

You measure AI search visibility by tracking how often, where, and how accurately AI engines mention and cite your brand when buyers ask questions in ChatGPT, Perplexity, Gemini, and Google AI Overviews. The core metrics are share of voice, citation frequency, citation share, sentiment, and query coverage. You also need a fixed prompt panel and a regular cadence, because a single “does AI mention us” check is an anecdote, not a measurement.
This guide gives you the exact metrics to track, a manual method that costs nothing, a decision matrix for buying a tracker, and the correlation chain that connects AI visibility to pipeline. It is written for a senior B2B marketer who already understands content and SEO, and who now needs to report on a channel where traditional rank tracking comes up short.
What Is AI Search Visibility, and Why Do SEO Metrics Miss It?
AI search visibility is the share of AI-generated answers in which your brand appears, gets cited, and is described accurately. Traditional SEO metrics miss it because they measure clicks on a results page, and AI answers are engineered to be zero-click. When a buyer asks ChatGPT or Perplexity a question, the model writes the answer itself and may or may not link your domain. That behavior is invisible to keyword rank, click-through rate, and organic sessions.
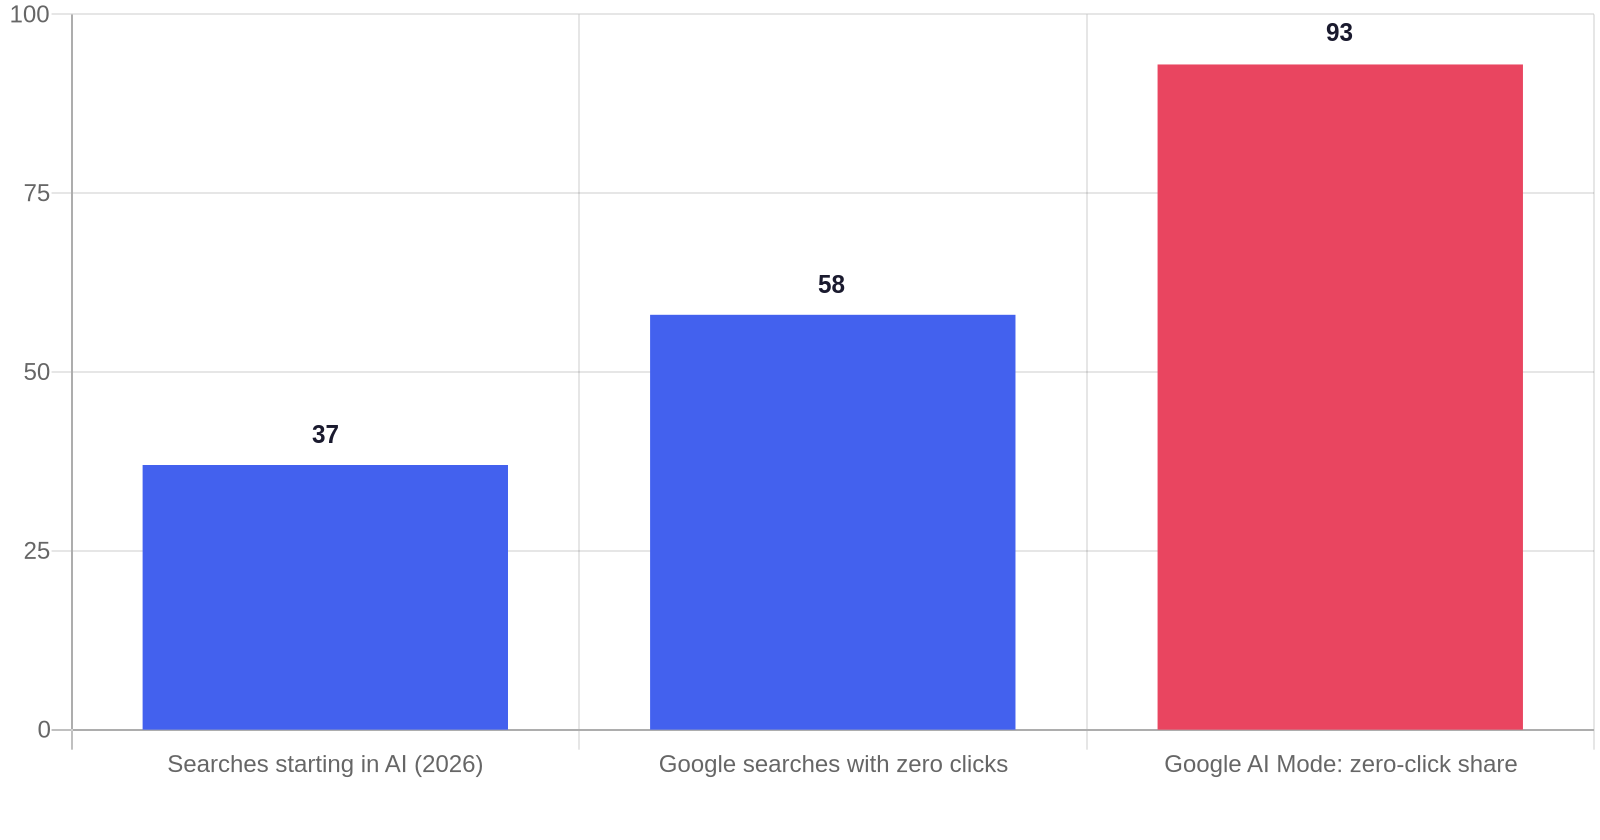
The scale of the shift justifies a separate measurement system. Search Engine Journal reports that 37% of user searches now start in an AI system rather than a traditional search engine, a figure cited in WP Engine’s 2026 tracking-tools roundup. In B2B, the effect is concentrated: research compiled in our guide on AEO vs GEO vs SEO shows that 84% of B2B buyers now use AI tools during discovery, up from 24% a year earlier. And the answer box rarely hands the click over. Frase’s 2026 AI visibility guide puts zero-click share at 58% of Google searches overall and 93% inside Google’s AI Mode.
The mismatch between SEO and AI is real and measurable. Profound’s 2026 tracking guide reports that ChatGPT citations overlap Google’s top organic sources only 39% of the time. Google’s own AI Overviews overlap the top 20 organic results about 54% of the time, per the citation research we published in our original B2B research program guide. In plain terms, you can rank on page one of Google and still be absent from ChatGPT’s answer. The two channels need separate scorecards.
There is a payoff for doing it right. Semrush’s 2026 analysis of AI referral traffic found that LLM-referred visitors browse 12% more pages, bounce 23% less, and convert at 4.4 times the rate of traditional organic visitors. The buyers who arrive from an AI answer are further along, because the model already did the comparison work for them. That is the channel worth measuring.
The 5 Metrics That Actually Measure AI Visibility
Five metrics capture AI visibility: share of voice, citation frequency, citation share, sentiment, and query coverage. Track them as paired KPIs, never as isolated numbers, because a single metric on its own is too easy to game or misread.
1. Share of Voice, or Share of Model
Share of voice is the percentage of your tracked prompts in which your brand is mentioned or recommended, compared with your named competitors. Brand strategist Tom Roach calls it “the new share of in town,” a phrase cited in Foundation Marketing’s 2026 GEO metrics guide. It answers the simplest question a CFO asks: when AI engines talk about your category, how often do they say your name?
2. Citation Frequency vs Brand Mentions
Separate the two, because AI engines behave very differently. A brand mention is your name appearing in the narrative text of an answer. A citation is a clickable link or footnote pointing to your domain. get3rd’s 2026 measurement guide reports that ChatGPT links to sources only about 20% of the time, Google AI Overviews link roughly 60% of the time, and Perplexity almost always includes inline citations. If you count mentions as citations, you overreport ChatGPT and underreport Perplexity.
3. Citation Share and Source Breakdown
Citation share is the proportion of all citations in your category that point to your domain. Source breakdown is where those citations come from: owned properties, G2 and Capterra, Reddit, tier-one press, or YouTube. The mix matters because AI engines weight third-party consensus heavily. The research we published on getting AI engines to cite original research found that original first-hand data makes up 67% of top ChatGPT citations, and that structured HTML tables are 2.5 times more likely to be cited than unstructured text.
4. Sentiment and Accuracy
Sentiment measures whether the AI describes you positively, neutrally, or negatively. Accuracy flags hallucinations: wrong pricing, discontinued features, or your brand confused with a competitor. Foundation Marketing’s 2026 guide is blunt about the risk: you can rank first in visibility and still lose if the model frames you as “popular, but users complain about support.” A toxic citation is worse than no citation.
5. Query Coverage and Query Fanout
Query coverage is the share of the sub-questions your category generates in which your brand appears. Profound’s Nick Lafferty explains query fanout in his 2026 guide: one buyer prompt expands into many regional and temporal sub-queries inside the model. A buyer who types “best CRM for a 40-person sales team” generates dozens of hidden variations the engine evaluates. Coverage tells you whether you populate those hidden queries, not just the one you typed.
The AI Visibility Index: One Score Your Team Can Rally Around
The AI Visibility Index (AVI) is a 0-100 composite score built from the five metrics above: 40% share of voice, 30% citation frequency, 20% sentiment, and 10% query coverage. It turns a dashboard of noisy, model-by-model numbers into one trend line that an executive can read without a glossary. You compute it the same way every month, and the movement of the index is the report.
Here is a worked example so the formula is concrete, not abstract. Meridian Analytics is a fictional B2B software brand running a 12-prompt panel across ChatGPT, Perplexity, and Gemini. In one month, the model names Meridian in 5 of 12 prompts, links to its domain in 3, describes it accurately and neutrally or better in 4 of the 5 mentions, and appears in 6 of 10 identified fanout sub-queries. The score is (5/12 = 42 x 0.4 = 17) plus (3/12 = 25 x 0.3 = 8) plus (4/5 = 80 x 0.2 = 16) plus (6/10 = 60 x 0.1 = 6), for an AVI of 47. The team knows exactly which lever to pull: citation frequency is the weak pillar, so the fix list starts with making its comparison pages citeable.
The index follows the paired-KPI rule that Carlos Silva lays out in Semrush’s AI visibility measurement guide. Never report a single number alone. Report share of voice with citation share, mention count with sentiment accuracy, and your visibility with competitor gaps. The composite plus its parts is the honest story.
How to Measure AI Visibility With Zero Budget: The Afternoon Spot Check
With no paid tools, you can build a defensible baseline in one afternoon using the five-step spot check. It costs about two hours a month and works for teams that cannot justify a dedicated tracker yet. The method comes from get3rd’s 2026 measurement guide, and it is the vendor-neutral baseline every paid tool assumes you already have.
Continuing the Meridian example, the team runs its 12-prompt panel and logs the raw outcomes. It appears in 4 of 12 prompts, is cited in 2, and is described accurately in 3. One comparison prompt returns “Meridian is popular, but reviewers note limited integrations,” which drops sentiment below 100%. The weak pillars are obvious: citation frequency at 17% and coverage at 40%. The fix list writes itself. Refresh the comparison page with a schema-marked integration table, publish a benchmark study to earn third-party citations, and re-run the same panel next month to see if the index moves.
When to Buy a Tool: The AI Visibility Stack Decision Matrix
Buy a tracker when you track more than 15 prompts across more than 3 engines on a monthly cadence, or when you need trend history that a manual log cannot keep. Below that threshold, the manual spot check is the right call. The matrix below compares the four realistic tiers for a B2B team.
Two buying cautions from the market reviews. First, pricing is often credit-based or prompt-gated. Position Digital’s 2026 hands-on review of AI visibility tools notes that a 200-keyword, 5-engine daily plan can push a $99 subscription past $500 a month. Read the prompt math before you sign. Second, data collection method matters: some platforms pull answers through developer APIs, and Surfer’s research argues API-based collection misses what real users see in the UI. Ask whether a tool scrapes the live interface or calls an API before you trust its baseline.
For a lean B2B stack, the pragmatic order is manual spot check for 90 days, then a budget or full platform only when you are ready to defend a monthly number with trend history. Our guide to AI SEO tools for small teams walks through the adjacent software categories if you are building the whole stack at once.
How to Turn AI Visibility Into Revenue: The Correlation Chain
You connect AI visibility to revenue through a correlation chain, not direct click attribution. The chain has four links: citation share rises, branded search grows, direct and homepage traffic climbs, and conversions follow. You track the links in order because the final conversion is a lagging indicator, while citation share is a leading one.
Here is how the chain works in practice. Users encounter your brand inside an AI answer, then search for your brand by name on Google. That branded search is visible in Google Search Console, and Semrush’s 2026 guide recommends filtering Search Console for branded queries as the cleanest bridge metric. Branded searchers land on your homepage or product pages directly, and they convert at the 4.4x rate cited earlier because the AI already did their comparison work.
Because AI answers often produce no click at all, you need two attribution helpers that the sources agree on. First, set up GA4 filters that isolate referral sessions from chatgpt.com, perplexity.ai, claude.ai, and gemini.google.com. Second, add a self-reported field to your contact form: “How did you hear about us?” with an “AI assistant” option. Foundation Marketing’s 2026 GEO metrics guide reports the payoff: Tally captured 25% of new signups this way, and Docebo attributed 13% of high-intent leads to the same self-reported field.
Set expectations on timing. It takes 30 to 90 days for an optimized page to be crawled by AI bots, indexed, cited, and translated into branded-search spikes. Report leading indicators (prompt-level visibility and AVI) monthly, and tie them to branded search and pipeline quarterly or biannually. If you wait for revenue before reporting anything, you will kill the program before the chain completes.
This is also where the second buying audience shows up. AI agents are increasingly evaluating vendors before humans do, and the measurement discipline above is the only way to see whether you are winning that audience. Our guide to marketing to AI agents covers the audience side of the same problem.
The Measurement Cadence: Weekly, Monthly, Quarterly, Biannual
Run tactical checks weekly, trend analysis monthly, strategic reviews quarterly, and revenue correlation twice a year. This cadence comes from Walker Sands and Blue Compass, whose 2025-2026 GEO metric guides map the rhythm that keeps a program honest.
- Weekly: Audit your 15-20 golden prompts for sudden drops, negative sentiment, and competitor takeovers. This is alerting, not analysis.
- Monthly: Aggregate weekly data into visibility share and citation frequency trends. Document hallucination fixes and pick zero-to-mention pages to optimize.
- Quarterly: Run the deep sentiment and reputation pass across models. Re-check your engine list, because AI search popularity shifts fast. Re-benchmark competitor share of voice.
- Biannually: Correlate AVI and citation share against branded search, homepage conversions, and win-loss pipeline data. This is the report that funds the next cycle.
The cadence exists because AI models drift. Citation drift, the rate at which the model swaps your brand for a competitor or drops you entirely across sessions, is a real and measurable phenomenon in Foundation’s framework. A weekly check catches the drift early; a monthly one already lost a month of signal.
What Most Teams Get Wrong
The five mistakes below are the reasons most AI visibility programs produce a dashboard and no decision. Each one is documented in the 2026 sources this guide draws on.
- Treating a one-off prompt check as measurement. A single “does ChatGPT mention us” run is an anecdote. Position Digital’s review cites a SparkToro experiment showing less than a 1% chance that ChatGPT and Google’s AI return the identical brand list on two runs of the same prompt. Without repetition and a fixed panel, your “measurement” is noise.
- Counting mentions as citations. ChatGPT links to sources about 20% of the time. If your report says “we are cited in ChatGPT” when you are only mentioned, you will overstate the channel and get caught in the first exec review.
- Ignoring sentiment and accuracy. High mention volume with negative framing is a brand-safety risk, not a win. Track the hallucination rate and the share of descriptions that are factually correct, not just the raw number of appearances.
- Trusting API-only data over real UI behavior. Some tools pull answers through developer APIs that bypass the retrieval and layout real users see. If your tracker never touches the live interface, its baseline can disagree with what a buyer actually sees.
- Expecting direct attribution and quitting too early. There is no click-level revenue attribution for AI answers. Teams that demand it in month one abandon the program in month three, right before the 30-90 day chain completes. Leading indicators are the defensible report.
What to Do Next
Run the manual spot check this week and compute a baseline AVI before you buy anything. Build your 10-15 prompt matrix across the five buyer intents, run it in incognito across ChatGPT, Perplexity, and Gemini, and log the five data points per prompt. That baseline is the single most valuable artifact you can create, because every paid tool assumes it already exists.
Once you have the baseline, set the cadence: weekly alerts on golden prompts, monthly trend aggregation, quarterly sentiment, and biannual revenue correlation. If the manual method proves the channel is winning or losing, escalate to a budget or full-platform tracker with a real trend history. Pair every metric you report, and let the AVI trend line carry the executive conversation.
Start with the three-layer model of SEO, AEO, and GEO if you have not read it yet, then come back and build your scorecard. Measurement is the difference between betting on AI visibility and knowing it is working.
Frequently Asked Questions
What is AI search visibility?
AI search visibility is the share of AI-generated answers in which your brand appears, gets cited, and is described accurately across engines like ChatGPT, Perplexity, Gemini, and Google AI Overviews. It is measured with a fixed panel of buyer prompts, tracked over time, and reported through metrics like share of voice, citation frequency, sentiment, and query coverage.
How is AI search visibility different from SEO ranking?
SEO ranking measures where your page lands in a list of blue links that users click. AI search visibility measures whether a model mentions and cites your brand inside a synthesized answer. The two correlate only partially: ChatGPT citations overlap Google’s top organic results just 39% of the time, while Google AI Overviews overlap the top 20 organic results about 54% of the time.
Can I measure AI visibility without paid tools?
Yes. The manual spot check tracks a 10-15 prompt panel across ChatGPT, Perplexity, and Gemini in incognito sessions, repeated 3-5 times, with five logged data points per prompt. It takes about two hours a month and produces a defensible baseline and AVI score without spending anything.
Which AI engines should I track?
Start with ChatGPT, Perplexity, and Gemini, because they cover the two citation behaviors that matter: ChatGPT mentions generously but links rarely, while Perplexity links almost always. Add Google AI Overviews if your category gets SERP features, and Copilot or Claude if your buyers are heavy Office or developer users.
How often should I measure AI visibility?
Check golden prompts weekly for sudden drops and sentiment shifts, aggregate trends monthly, run a deep sentiment and engine-list review quarterly, and correlate with branded search and pipeline twice a year. The weekly and monthly layers matter most because AI models drift and swap citations across sessions.
How long until AI visibility drives revenue?
Expect a 30 to 90 day lag between optimizing a page and seeing citations, then branded search, then conversions. Report leading indicators like citation share and AVI monthly, and connect them to pipeline quarterly or biannually. Direct click-level attribution does not exist for AI answers, so the correlation chain is the honest proof.
