
B2B content marketing ROI is calculated by dividing the revenue attributed to content by the total cost of content production and distribution, then multiplying by 100.
The challenge is not the formula itself but accurately attributing revenue across long, multi-touch buying cycles. This guide gives you the framework to do that right.
Table of Contents
Why Most B2B Teams Measure Content ROI Wrong
Most B2B marketers are measuring the wrong things. They track pageviews, social shares, and email open rates, then wonder why the CFO does not take content marketing seriously.
Here is the problem: vanity metrics feel good but prove nothing. A blog post with 10,000 monthly visitors that generates zero pipeline is not an asset. It is a liability in disguise, consuming budget and team time with no return.
According to the Content Marketing Institute’s B2B research, 56% of B2B marketers cite difficulty attributing ROI to content efforts as their top measurement challenge. And 44% say they cannot tie content performance to business goals at all. That is not a measurement problem. It is a strategy problem that shows up as a measurement problem.
The fix is not a better analytics tool. The fix is starting with a clear question: what business outcome does this piece of content exist to drive?
When you know the answer, measuring ROI becomes straightforward. When you do not, no dashboard in the world will save you.
Action Step: Before measuring anything, list the three business outcomes your content program exists to drive this quarter. Pipeline generated, sales cycle reduction, and customer retention are good starting points.
The B2B Content Marketing ROI Formula (With Real Examples)
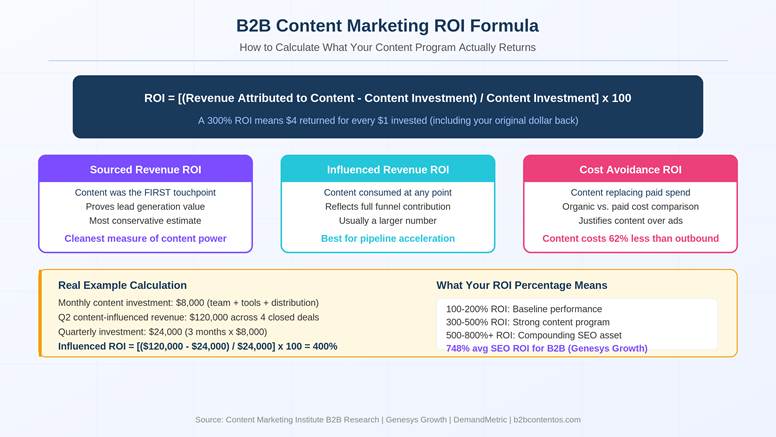
B2B content marketing ROI is calculated using this formula: ROI = [(Revenue Attributed to Content – Content Investment) / Content Investment] x 100
This gives you a percentage. A 300% ROI means that for every $1 you spent on content, you generated $4 in return ($3 net gain on top of your $1 investment).
In practice, there are two variations you need to know:
Sourced Revenue ROI measures deals where content was the first touchpoint that brought the buyer into your funnel. This is the cleanest measure of content’s lead generation power.
Influenced Revenue ROI measures deals where content was consumed at some point in the buying journey, even if it was not the first or last touchpoint. This is almost always a larger number and reflects content’s role in building trust and accelerating deals.
| ROI Type | What It Measures | Best Used For |
| Sourced Revenue ROI | Content as first touch | Proving lead generation value |
| Influenced Revenue ROI | Content across the journey | Proving pipeline acceleration |
| Cost Avoidance ROI | Content replacing paid spend | Justifying content over ads |
| Retention ROI | Content reducing churn | Customer success content |
Example: Suppose you spend $8,000 per month on content (writer, editor, SEO tool, and distribution). In Q2, your CRM shows that 4 closed deals totaling $120,000 in revenue were influenced by content. Your influenced ROI is [(120,000 – 24,000) / 24,000] x 100 = 400%. That is a story your CEO will understand.
Action Step: Run this calculation for your last completed quarter using whatever revenue data you have. Even a rough number is better than no number.
How to Calculate Your True Content Investment
Most teams underestimate their content investment by 40-60% because they only count the obvious costs. This inflates their apparent ROI and creates credibility problems when those numbers are scrutinized.
Your true content investment includes:
Direct Costs: Writer and editor salaries or freelancer fees, design and video production, SEO tools (Semrush, Ahrefs, Clearscope), content management system and hosting, and paid distribution (LinkedIn Ads, content syndication).
Hidden Costs That Most Teams Forget: Subject matter expert time for interviews and review, marketing manager time for strategy, briefing, and oversight, sales team time for content review and feedback, and analytics and reporting time.
The Full-Cost Formula: Total Content Investment = Direct Spend + (Hours of Internal Time x Blended Hourly Rate) If your content team of three spends 60% of their time on content at an average salary of $80,000/year, your internal cost alone is $144,000 annually before a single freelancer invoice or software subscription.
Action Step: Build a simple spreadsheet that captures both direct costs and internal time this month. Use it as the denominator in every ROI calculation going forward.
Attribution Models: Which One Actually Works for B2B
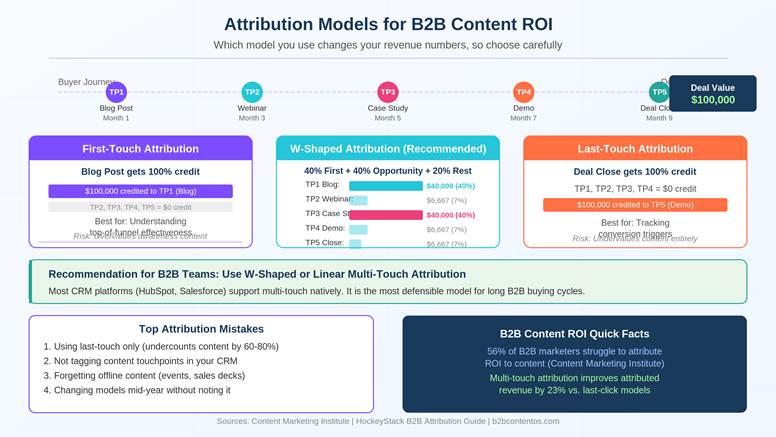
Attribution is where most B2B content ROI conversations break down. The model you choose changes your numbers dramatically, and choosing the wrong one leads to bad decisions.
First-Touch Attribution gives 100% of revenue credit to the first piece of content a buyer consumed. This is useful for understanding what drives awareness, but it ignores everything that happened between awareness and close.
Last-Touch Attribution gives 100% of credit to the final content touchpoint before a deal closed. This overstates the value of bottom-funnel content like pricing pages and undervalues the blog posts that created awareness months earlier.
Multi-Touch Attribution distributes credit across all content touchpoints in the buyer journey. This is the most accurate model for B2B, where buying cycles can span 6 to 18 months and involve multiple decision-makers consuming different content at different stages.
Linear Multi-Touch gives equal credit to every touchpoint. Time-Decay gives more credit to touchpoints closer to the close date. Position-Based (W-Shaped) gives 40% to first touch, 40% to the touchpoint that created the opportunity, and distributes the remaining 20% across the rest.
For most B2B teams with small marketing stacks, W-shaped or linear multi-touch is the right starting point. It is defensible, practical to implement in HubSpot or Salesforce, and tells a coherent story.
The practical shortcut: If full multi-touch attribution is beyond your current toolset, use influenced revenue as your proxy. Tag any contact who consumed content before a deal closed and report on the total revenue from those deals. It is imperfect but directionally accurate and buildable today.
Action Step: Check which attribution model your CRM is currently using. If it is last-touch only, switch to multi-touch or start tagging content-influenced contacts manually.
The Metrics That Actually Predict Revenue
Not all content metrics are created equal. Some are leading indicators that predict future revenue. Most are lagging vanity metrics that tell you what already happened.
Leading Indicators (Track These Weekly):
Organic keyword rankings for buying-intent terms: If you rank in the top 3 for “b2b content marketing roi calculator,” you will generate leads. Rank improvement predicts future traffic and leads.
Content-qualified leads (CQLs): Contacts who consumed 3+ pieces of content before requesting a demo convert at higher rates. Track this as a CQL metric.
Time-to-pipeline from content touchpoints: How long does it take from a contact’s first content interaction to them becoming an opportunity? Shortening this is a direct ROI driver.
Sales cycle length for content-influenced vs. non-content-influenced deals: If content-influenced deals close faster, that is a measurable acceleration in revenue.
Lagging Indicators (Track Monthly, Not Weekly):
Revenue attributed to content (sourced and influenced), cost per content-qualified lead, customer acquisition cost (CAC) for content-sourced customers, and customer lifetime value (LTV) for content-sourced vs. other channels.
| Metric | What It Tells You | Reporting Frequency |
| Organic ranking for buyer-intent keywords | Future traffic and lead volume | Weekly |
| Content-qualified leads | Sales pipeline quality | Weekly |
| Content-influenced pipeline | Revenue contribution | Monthly |
| Content-sourced revenue | Direct revenue generation | Quarterly |
| CAC from content vs. paid | Cost efficiency comparison | Quarterly |
| Content LTV ratio | Long-term profitability | Annually |
The metric that matters most to your CFO: Content-attributed pipeline as a percentage of total pipeline. If your content generates 35% of your company’s pipeline at 60% lower CAC than paid acquisition, you have a budget conversation that practically writes itself.
Action Step: Identify one leading indicator and one lagging indicator your team will report on starting this month. Do not try to track everything at once.
B2B Content ROI Benchmarks by Channel
One of the most common questions B2B marketers ask is: “Is our ROI good?” Here are verified benchmarks to compare against.
According to research compiled by Genesys Growth, SEO delivers an average 748% ROI for B2B companies. That number sounds extraordinary, but it reflects the compounding nature of organic content: a well-ranked article can generate leads for years with zero incremental spend.
According to the Content Marketing Institute’s annual B2B report, 58% of B2B marketers say content marketing has helped them increase sales and revenue in the past 12 months. The top goals where content performs best are brand awareness (84%), lead and demand generation (76%), and lead nurturing (63%).
Cost Efficiency Benchmark: Content marketing costs 62% less than traditional outbound marketing while generating approximately three times as many leads, according to research from DemandMetric cited across multiple industry sources.
| Channel | Average ROI | Time to First ROI | Compounding Effect |
| SEO / Organic Blog | 748% | 6-12 months | Very High |
| Email Marketing | 261% | 1-3 months | High |
| Webinars | 213% | Immediate | Medium |
| Case Studies | Varies (deal-accelerant) | Varies | High for BOFU |
| Video Content | 49% faster vs. text | 3-6 months | Medium |
| Paid Content Amplification | 100-300% | Immediate | Low |
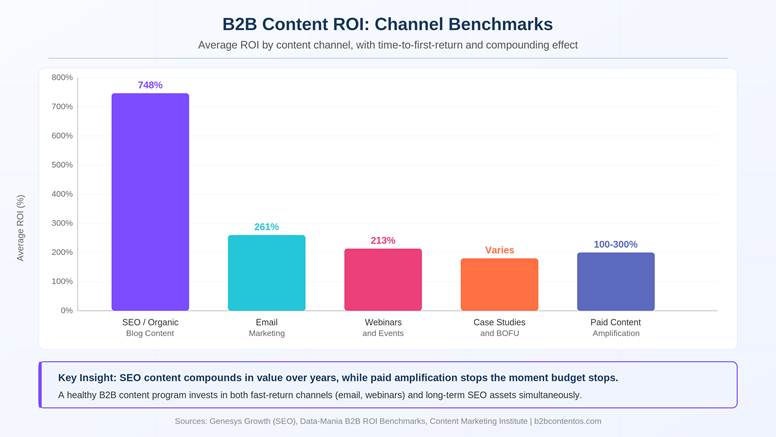
Key insight: SEO-driven content has the highest long-term ROI but the longest time to first return. Webinars and email provide faster signals. A healthy content program uses both.
Action Step: Compare your current content spend allocation against these benchmarks. If you are spending 80% on content production and 0% on SEO optimization, your ROI will underperform.
How to Build a Content ROI Dashboard Your CEO Will Trust
A good content ROI dashboard answers one question for each audience: Finance wants to see revenue. Marketing wants to see pipeline. Content wants to see what is working.
The Three-Layer Dashboard
Layer 1: Executive Summary (For the CEO and CFO): Total revenue sourced by content this quarter, total revenue influenced by content, content CAC vs. paid channel CAC, and content investment as a percentage of total marketing budget.
Layer 2: Marketing Performance (For the CMO and Marketing Team): Organic traffic trend month-over-month, content-qualified leads generated, content-influenced pipeline (open and closed), and top 10 content pieces by pipeline contribution.
Layer 3: Content Operations (For the Content Team): Articles published vs. target, average time to rank in top 10 for target keywords, content decay rate (pieces that have lost ranking), and republishing and update backlog.
The tool stack that makes this buildable without an analyst: You need three things, Google Search Console (free, shows keyword rankings and organic clicks), your CRM (HubSpot, Salesforce, or Pipedrive, to track content-influenced contacts and deals), and Google Analytics 4 or a similar tool (to connect content consumption to goal completions).
The connection between these three tools, mapping a contact’s content history to their CRM record and eventual deal outcome, is where the ROI story comes together. This is exactly what we built the free ROI Predictor tool at B2BContentOS to help you model. A well-run content audit using our best content audit tools guide can also reveal which existing content pieces are driving the most pipeline value.
Action Step: Build Layer 1 of this dashboard first. Even a manual Google Sheet updated monthly is better than no dashboard at all. Start there, then automate.
Common ROI Measurement Mistakes (and How to Fix Them)
These are the mistakes we see most consistently in B2B content programs. Each one silently inflates or deflates your apparent ROI.
Mistake 1: Only measuring traffic, not pipeline
Traffic is a proxy metric, not a business outcome. A piece of content that gets 500 monthly visitors from buyers who fit your ICP is worth more than one that gets 5,000 visitors from students and researchers.
Fix: Segment organic traffic by company size, industry, or job title using Clearbit Reveal or similar enrichment tools. Measure qualified traffic, not total traffic.
Mistake 2: Ignoring content decay
The average top-ranking piece of content loses 25-50% of its traffic within 12-18 months without updates. If you are not tracking decay, your ROI calculations are based on outdated content assumptions.
Fix: Use our how to do a B2B content audit guide to build a quarterly review process that catches decaying content before it drops off page one.
Mistake 3: Not giving credit to content that assisted deals
If your attribution model only looks at first-touch or last-touch, you are systematically undercounting content’s contribution to revenue. A blog post read by a prospect six months before they bought is invisible in a last-touch model.
Fix: Implement multi-touch attribution in your CRM and report on content-influenced revenue, not just content-sourced revenue.
Mistake 4: Comparing content ROI to paid ROI unfairly
Paid ads stop the moment you stop spending. Content compounds. A three-year comparison always favors content because it accounts for the cumulative effect of ranking assets.
Fix: When presenting content ROI to leadership, always include a time-horizon dimension. Show what a piece of content earns in Year 1 vs. Year 2 vs. Year 3 without additional spend.
Mistake 5: Not connecting marketing metrics to sales outcomes
Marketing tracks leads. Sales tracks deals. Neither team looks at the full picture.
Fix: Create a shared content performance report that Marketing and Sales review together monthly. Include which content pieces prospects consumed before buying, and let Sales tell you what actually matters at each stage. Our guide on B2B content marketing strategy covers this alignment framework in detail.
Action Step: Audit your current measurement setup against these five mistakes this week. Pick the one that is costing you the most credibility and fix it first.
What to Do Next
Measuring B2B content marketing ROI is not a one-time project. It is a system you build once and improve every quarter.
Start here: Calculate your content investment for last quarter using the full-cost formula in this article. Then pull your CRM data and identify which closed deals involved a contact who consumed content. That rough calculation, even if imperfect, is your baseline.
From there, read our deep-dive on harnessing marketing automation for B2B content marketing to understand how to set up automated tagging that makes attribution tracking scalable without manual work.
And if you want to model what your content program could return before you have 12 months of data, the ROI Predictor tool at B2BContentOS lets you input your current metrics and see projected returns by channel, timeline, and content type.
The teams that win at B2B content are not the ones with the biggest budgets. They are the ones who measure relentlessly, cut what does not work, and double down on what does. Start measuring this week. For more tactics, explore our 15 content marketing ideas for B2B that deliver results.
FAQ
What is a good ROI for B2B content marketing?
A good B2B content marketing ROI is generally considered to be above 300%, meaning you generate at least $4 in revenue for every $1 invested. SEO-driven content programs often reach 500-800% ROI over a 2-3 year period because content compounds in value over time, unlike paid advertising which stops generating returns the moment you stop spending.
How long does it take to see ROI from B2B content marketing?
Most B2B content programs take 6-12 months to show measurable organic ROI, with the strongest returns appearing in years 2 and 3 as content compounds. Paid content distribution and email campaigns can show ROI in weeks. The most accurate timeline depends on your domain authority, content quality, and keyword competition.
What is the best attribution model for B2B content marketing ROI?
Multi-touch attribution is the most accurate model for B2B content marketing because B2B buying cycles involve multiple touchpoints across weeks or months. W-shaped attribution (40% to first touch, 40% to opportunity creation, 20% distributed across other touches) is a practical starting point that most CRM platforms support natively.
How do I measure content marketing ROI without a CRM?
Without a CRM, you can measure content ROI by tracking: (1) form submissions and demo requests that originate from organic search using UTM parameters, (2) content downloads linked to email nurture sequences that generate sales conversations, and (3) a monthly review with your sales team to identify which prospects mention specific content pieces. It is manual but directionally accurate until you have a CRM in place.
What costs should I include when calculating content marketing ROI?
Your content investment should include: writer and editor salaries or freelancer fees, design and video production costs, SEO and content tools, paid distribution, and internal team time spent on strategy, briefing, review, and reporting. Most teams underestimate their investment by 40-60% by leaving out internal time, which overstates ROI and creates credibility problems.
How is B2B content marketing ROI different from B2C?
B2B content marketing ROI is harder to measure than B2C because B2B buying cycles are longer (typically 6-18 months), involve multiple stakeholders, and require multi-touch attribution models. B2C content often has a direct click-to-purchase path. In B2B, a blog post might influence a deal that closes 9 months later, making single-touchpoint attribution models deeply inaccurate.