

Only 8% of B2B marketers can measure content ROI. Here is the fix.
If you cannot show what a blog post is worth in revenue, you cannot defend your budget. That is the blunt reality behind a Content Marketing Institute finding: only 8% of B2B marketers believe they measure their content’s ROI and influence on revenue successfully, even though content now eats 25% to 40% of the average B2B marketing budget. This guide gives you a concrete system to measure blog ROI in B2B with nothing more than Google Analytics 4 and a CRM, the exact stack most lean teams already own.
I have worked with content programs that spend six figures a year and cannot tell you which ten posts built their pipeline. The failure is never a missing tool. It is a missing definition of what success looks like. 55% of B2B marketers say it is unclear within their organization what an effective content program actually looks like. If the goal is fuzzy, the measurement will be fuzzy. So step one is not technical. It is definitional.
The 8% trap is a definition problem, not a technology problem
Most teams chase the wrong thing first. They buy an attribution platform before they decide what “ROI” means to their business. That is backwards. The math is simple once you define a valuable outcome. The hard part is getting the whole team to agree on that outcome in a 30-minute meeting.
The data makes the disconnect painful. Content is a large share of your budget, most teams have unclear goals, very few can measure, but buyers clearly use your content. The chart below shows the gap in one view.
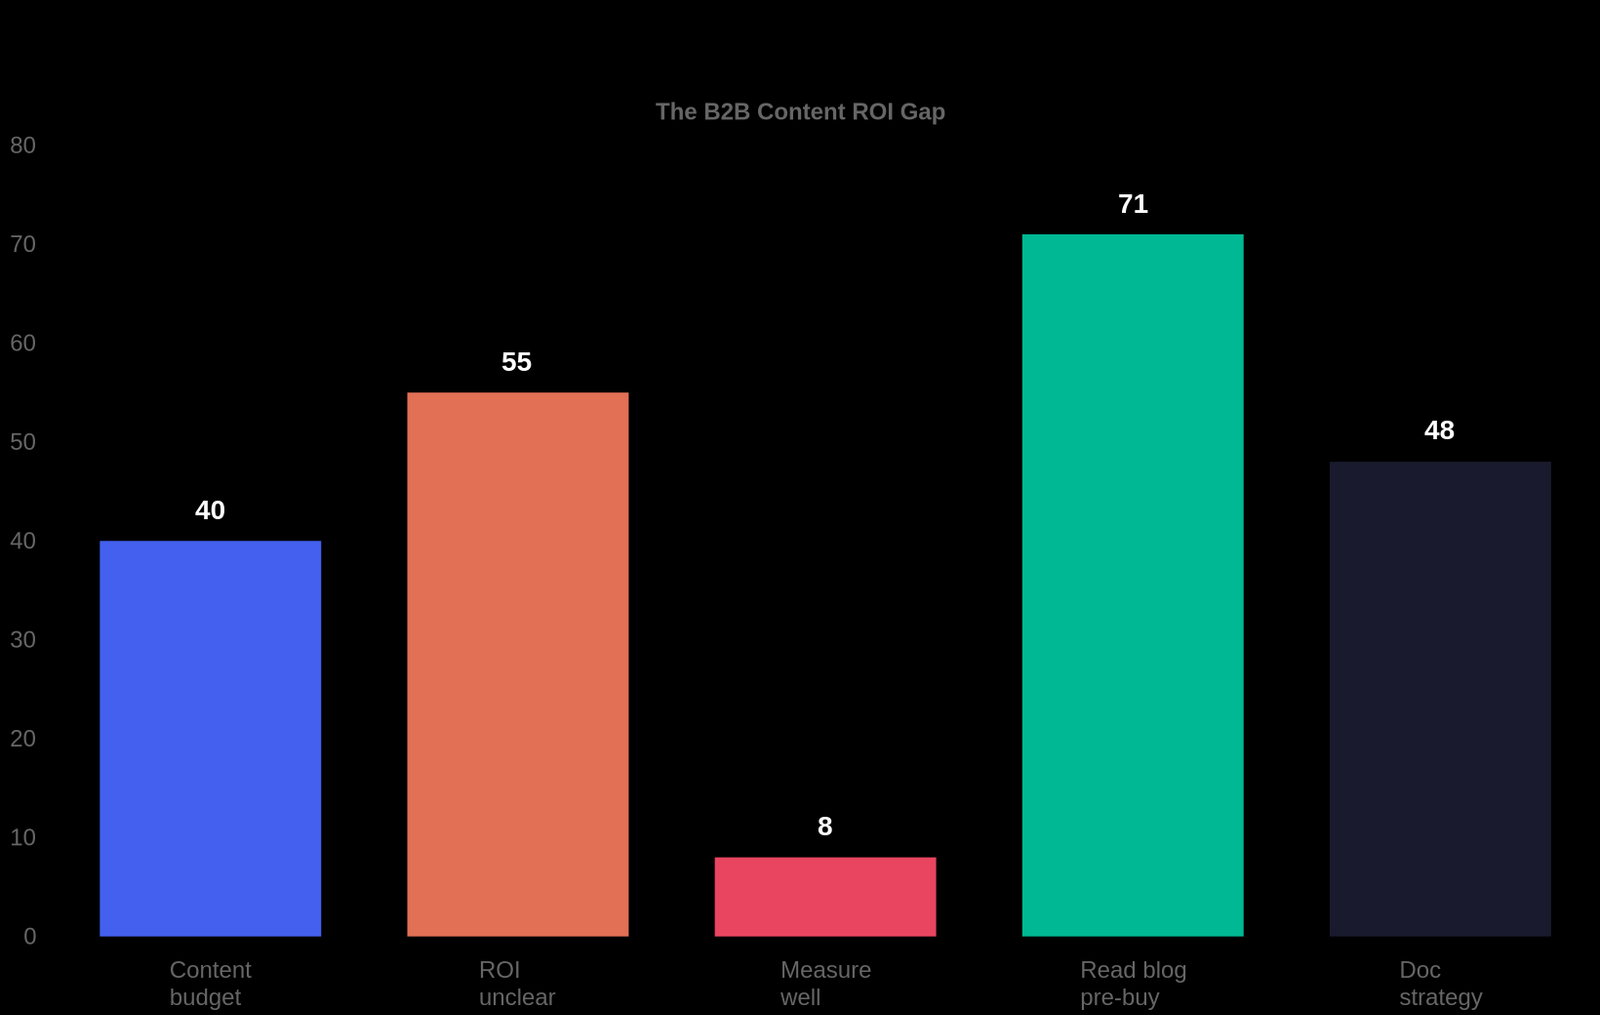
The gap between the 71% of buyers who read your blog before buying and the 8% who can prove it is where you win. Close the measurement gap and you can justify more budget, kill the posts that drain spend, and double down on the content that actually moves pipeline. Teams that align on a clear definition of success immediately report a higher effectiveness rate of 55%, per the same CMI research.
Name your outcome and price it: the Pipeline ROI Map
I call the framework in this guide the Pipeline ROI Map. It has four layers, and you fill them top to bottom. Each layer answers one question a confused team cannot answer.
- Define the revenue endpoint. Pick the one action that means money: a booked demo, a signed trial, a closed-won deal. This is not the newsletter signup. Pick the event your sales team cares about.
- Price that endpoint. Divide the average deal size by your historical win rate. If deals average 50,000 dollars and one in four closed opportunities converts, each closed opportunity is worth 50,000 dollars of expected revenue on the chance it wins.
- Link the blog to that endpoint. Decide how much credit any single post gets. This is the attribution decision, covered in the next section. For a first pass, position-based credit is the sensible default.
- Divide by production cost. Total the labor cost to research, write, edit, and publish the post. The ratio of attributed revenue to that cost is your blog ROI.
Here is the key rewrite most guides skip. The formula is not a mystery. It is just this:
Blog ROI = (Revenue attributed from the blog) / (Total cost to produce the blog)
Apply it at the post level, the topic-cluster level, the channel level, and the whole-blog level. The map works at every zoom. When your CFO asks for one number, the whole-blog number is your answer. When your editor asks which topic to cut, the post-level number is theirs.
A worked example you can copy into a spreadsheet
Concrete numbers make the framework real. Picture a mid-market security software company, call it SentinelEdge, with a single blog post titled “How to choose a SOC 2 vendor for your startup.” Here is the math they run in a spreadsheet.
The post pulls 800 unique visitors in a month: 500 from organic search, 300 from email and one LinkedIn share. Of those 800, 60 people book a demo. SentinelEdge’s sales team converts about one in four demos to a closed deal, and the average closed deal is worth 20,000 dollars in year-one revenue. So each demo is worth 5,000 dollars of expected revenue (20,000 times a 25% close rate).
| Metric | Value |
|---|---|
| Unique visitors to the post | 800 |
| Demo bookings | 60 |
| Demo to deal close rate | 25% |
| Average deal value | $20,000 |
| Expected revenue per demo | $5,000 |
| Total expected revenue attributed | $15,000 |
| Cost to research, write and edit the post | $1,200 |
| Return on every dollar spent | 12.5x |
That 12.5x number is defensible. It uses real visitor data, a real close rate, and a real average deal. It beats a page-view count every time in a budget meeting. If you cannot price a demo, price the next best action, a qualified lead, and state the conversion path you assumed. The CFO cares that you can show your work.
Attribution: the multi-touch reality most pages ignore
Here is the flaw in most blog ROI advice. It treats a buyer as if they read one post, fill a form, and buy. Real B2B buyers do not work that way. 71% of B2B customers read a blog at some point before finalizing a purchase, but they rarely convert on the first visit. They read six posts, a case study, and a comparison page over a sales cycle that can stretch six to twelve months. Single-touch models miss most of that journey.
The term for the unseen part is the “dark funnel.” These are anonymous, cookieless research sessions that happen before a formal form-fill. A first-touch model gives credit to the first blog anyone read. A last-touch model gives credit to the post right before the signup. Both understate what educational content actually did to create and move demand.
For a first measurement pass, you do not need enterprise attribution software. Compare first-touch and last-touch in your CRM reports. Where the two disagree the most, that gap is your blog quietly doing the heavy lifting in the middle of the funnel. When you can justify it, move to position-based credit, which splits credit roughly 40-20-40 across first, middle, and last touches. It is the best default for long B2B cycles.
What most teams get wrong about blog ROI
Four errors explain most measurement failures. Spot them in your own program before you blame the tools.
- They reward traffic, not revenue. A post with 10,000 views and zero demos is not a win. It is a cost center with good reach. Measure the action that leads to money, not the view count.
- They treat top-of-funnel content as unmeasurable. Educational posts rarely convert directly, so teams write them off. That is wrong. 60% of B2B customers prefer not to use sales reps, and 68% would rather research independently online. Your educational posts are the sales team for those buyers. Value them through position-based credit.
- They wait for the perfect stack. You do not need a data warehouse to start. GA4 plus your CRM gives you enough to price a post today. Start manual, prove the approach, then invest in tooling once the math justifies it.
- They never align the team. The most effective content teams meet daily or weekly. Only 32% of B2B marketers document their content strategy. If the people producing and the people selling never talk, the measurement will stay broken no matter what software you buy.
The Zero-Budget Stack: measure blog ROI with GA4 and your CRM
You can build a working multi-touch blog ROI system with two tools you almost certainly already have. Here is the step-by-step workflow.
Step 1: Fix your UTM tracking
Every link you place in an email newsletter, a LinkedIn post, or a guest article needs a consistent UTM tag. Define a naming convention once: source, medium, campaign, and content. Without tags, GA4 cannot tell you which post drove a visit, so the whole chain breaks. Make the convention part of your content workflow so no post ships untagged.
Step 2: Configure GA4 for content paths
Set up GA4 custom dimensions to capture unique visitors, session duration, and a landing path for each blog page. Export this to a spreadsheet weekly. You want one row per post with unique visitors, sessions, and an engagement signal. This is your traffic layer, and it is also the input to your conversion calculation.
Step 3: Map leads to the posts they read
Configure your CRM to capture the first and last UTMs on a lead record at the moment of conversion. If you use HubSpot or Salesforce, both store the original and latest source out of the box. This gives you first-touch and last-touch data without any extra software. It is the single cheapest way to approximate multi-touch attribution.
Step 4: Price outcomes in a spreadsheet
Build a simple table linking each post to its unique visitors, its attributed conversions, the revenue per conversion, and the production cost. Apply the formula from the worked example. Recompute monthly. This is your Pipeline ROI Map in action form, and it runs on a shared sheet your whole team can see.
Step 5: Review on a cadence
Review the map weekly or biweekly, not quarterly. The most effective B2B content teams meet daily or weekly, and 61% of those say the meetings are highly valuable. A weekly 30-minute review of the three best and three worst posts drives more improvement than a quarterly report no one reads.
How the Pipeline ROI Map compares to the alternatives
You have more than one way to talk about content performance, and it helps to know when this framework is the right tool. The table below lines up the common approaches against the map.
| Approach | What it answers | Where it falls short | Use it when |
|---|---|---|---|
| Traffic dashboards (GA4 reports) | How many people read the blog | Confuses views with value | Monitoring reach week to week |
| Search rankings | Which keywords the blog wins | Ranking is not revenue | Tracking SEO progress |
| Inbound lead counts | How many forms the blog filled | Leads with no revenue price | Reporting demand volume |
| Pipeline ROI Map | What the blog is worth in revenue | Needs clean source data | Budget, planning and cuts |
| Enterprise attribution tool | Full credit across every touch | Costs five figures to run | After the map proves the case |
The map sits between gut feel and a six-figure tech stack. It gives you a revenue number you can defend, with tools you already pay for. That is the sweet spot for lean B2B teams, and it is the reason the framework is worth building before you buy anything else.
Reading the map: which posts deserve more budget
Once you price ten or twenty posts, patterns appear fast. Group them into three buckets and act on each one.
- Proven revenue posts. High attributed revenue, low cost. These are your keepers. Double the production depth, add fresh research, and refresh them on the six-to-twelve-month cycle.
- Quiet influencers. Rarely convert directly but appear in assisted conversions again and again. These are your trust builders. Protect them from cuts even when their direct numbers look low.
- Cost sinks. High production cost and no attributable revenue across a full cycle. These are candidates to merge, rewrite, or retire. Run them through the content SEO audit checklist before you delete anything, because a thin post is often salvageable with a rewrite.
The discipline of the map is that every post lands in exactly one bucket. There is no middle category called “feels important.” If a post does not make a bucket, you do not know what it does, and that is the signal to investigate before you spend another dollar on it.
What your CFO actually wants to see
Bringing page-view numbers to a finance review is how content budgets get cut. Budget conversations hinge on a different set of numbers, and the map gives you all of them in one sheet. Prepare these four lines before the meeting.
- Total blog revenue attributed this quarter, with the position-based model documented.
- Total blog production cost, including a realistic hourly rate for every person who touched the content.
- The ratio of the two, your blog ROI, shown side by side with last quarter so the trend is visible.
- A one-line action list: the two posts you will double down on and the two you will cut.
That final line matters most. A CFO does not reward you for explaining complexity. They reward you for showing a decision backed by a number. When you can say “these two posts returned four times their cost and I am shifting budget to them,” you have stopped talking about content and started talking about investment.
Why your educational content still matters even when it never converts
It is tempting to cut every post that does not produce a form-fill. Do not. Buyers are self-educating. They will not take a demo when they have not built trust, and your educational content is what builds that trust. The fix is not to stop producing top-of-funnel content. It is to price it correctly through attribution instead of writing it off as a brand cost.

Map each educational post to the persona and the journey stage it serves. Ask what question it answers for a buyer in research mode. Then let position-based credit assign it the share of pipeline it actually influenced. When you can show that a “how to” post influenced three closed deals even though it never converted anyone directly, you have turned your biggest cost center into your most defensible asset.
Frequently asked questions about measuring B2B blog ROI
What is the simplest blog ROI formula for a small B2B team?
Divide the revenue attributed to your blog by the total cost to produce it. For a single post, price the conversion event (a demo, a qualified lead), multiply by the expected revenue per event, and divide by production cost.
Which attribution model should I use if I have no budget?
Start with first-touch and last-touch data from your CRM’s built-in original and latest source fields. Compare the two. Where they diverge most, that gap is your blog’s mid-funnel influence. Move to position-based credit when you can.
How do I value a blog post that never generates a lead?
Do not judge it on direct conversions. Use position-based attribution to give it credit for pipeline it influenced. Track it to a persona and journey stage, and measure assisted conversions in your CRM.
How often should I measure and report blog ROI?
Compute the numbers monthly and review the best and worst posts weekly or biweekly. A weekly 30-minute review beats a quarterly report for driving improvement.
What if my CRM and analytics do not match?
That mismatch is usually a UTM tagging problem. Audit your tags first, standardize the convention, and recheck. Clean source data is the precondition for any attribution model.
Do I need to track every click to measure ROI?
No. You need consistent tracking on your primary conversion paths, not every hover. Start with the top ten posts that drive the most demos, price them, and expand from there.
What to do next
You now have everything you need to move from the 8% who measure to the majority who only guess. Do not try to build the perfect system in a week. Start with the highest-funnel post that you suspect drives the most demos, price it with the formula above, and bring the number to your next team meeting. One defensible number beats a dashboard full of page views.
Once that single post is priced, expand to your top ten, agree on your attribution default, and put the review on your weekly cadence. If you need the strategic context that frames all of this, our B2B content marketing strategy guide sets the operating structure, and the deep dive on B2B content marketing ROI covers the full measurement discipline. For teams that want to fix the audit side first, the B2B content audit process and the content SEO audit checklist are the natural companions.
