

A content scoring model is a weighted scoring system that tells you which blog posts deserve a refresh first, based on decay, ranking position, conversion value, intent drift, and effort. It replaces guesswork and chronological updates with a repeatable, data-backed decision. This guide gives you a named 5-factor framework, the exact weights and thresholds, a decision matrix, a step-by-step workflow with a worked example, and the gaps most scoring guides miss.
What is a content scoring model for B2B blogs?
A content scoring model assigns each blog post a numeric score across a set of weighted factors, then sorts the list so you refresh the highest-value pages first. It is a prioritization system, not a quality grading system. The score tells you what to do next, and the weights tell you which signals matter most to your business.
For B2B teams the stakes are concrete. 92% of monthly blog leads come from older posts, writes Kayla Schilthuis-Ihrig, growth writer at HubSpot, whose team runs exactly this kind of refresh backlog against new-content bets. Search Engine Land measures an average organic decay rate of about 1.21% per week, which compounds to roughly 46% of your traffic in a year if nothing is touched. Airops estimates content refreshes return 3 to 5 times the ROI of net-new content. The bottleneck is never effort. It is deciding which pages to spend that effort on.
That is exactly what a scoring model solves. You run every post through the same criteria, get a number, and work down the list. The steps for prioritizing refresh cover the manual version of this queue.
Why most content scoring models fail B2B teams
Most published scoring models fail because they grade content in isolation, without refresh in mind. Mailchimp scores relevance, structure, engagement, SEO, and visuals out of 25. Progress scores keyword frequency, scannability, time on page, bounce rate, and speed. Both tell you how good a page looks today. Neither tells you which decaying page will move revenue if you update it.
The page-1 guides also skip the signals that matter most in 2026: AI-citation risk, intent drift, and effort. MarketMuse and seoClarity argue, correctly, that backward-looking vanity metrics have low predictive value. But they stop at a topical-completeness score. No major guide on page 1 gives B2B teams a formula that combines decay, striking-distance position, conversion value, AI citation risk, and effort into one number, then tells you the exact cutoff for refresh versus prune.
That gap is the opportunity. The framework below is built from the research of Digital Applied, Search Engine Land, Airops, Quattr, Mailchimp, Progress, and seoClarity, and it fixes the three failures above: arbitrary weights, no AI-citation input, and no effort adjustment.
The Refresh Priority Score: a 5-factor framework for B2B
The Refresh Priority Score (RPS) is a weighted 5-factor model. Score each post from 1 to 5 on every factor, multiply by the weight, add the results, and divide by 9 for a final 1-to-5 score. Higher means refresh it sooner.
The five factors cover the three failure modes above. Decay velocity and striking distance replace the vanity metrics that MarketMuse and seoClarity reject. Conversion value keeps the model tied to revenue. AI citation risk is the input no page-1 guide includes, and it matters because AI search now rewards fresher, more structured pages. Effort prevents you from spending three days on a post that a light update could rescue.
How to interpret the score: a decision matrix
Use the score bands below to route every post into one of four actions. The matrix maps the RPS number to a concrete action, with the reasoning behind each threshold.
Here is a worked example so the matrix is not abstract. Imagine a mid-market SaaS company, call it AcmeCRM, with a 400-post blog. The scoring run surfaces three posts. Post A is a pricing guide ranking at position 6, down 35% traffic in 90 days, targeting a bottom-of-funnel keyword, and it is 18 months old. It scores decay 5, striking 4, conversion 5, AI risk 5, effort 3, for an RPS of (10+8+7.5+7.5+3)÷9 = 4.0. It gets a full refresh. Post B is a how-to ranking at 12 with mild decay, mid-funnel value, and a light update path. It scores 3.4 and goes in the standard batch. Post C is a 2019 listicle with no impressions, no conversions, and duplicate intent with a pillar. It scores 1.2 and gets pruned with a redirect. That is the whole model working in one pass.
How to build your scoring sheet: a 5-step workflow
Follow these five steps to score your entire blog in an afternoon. Each step has a concrete action, and the workflow is designed for a lean team with just Google Search Console, Google Analytics, and a spreadsheet.
- Export your data. Pull Search Console performance for the trailing 90 days with queries, impressions, clicks, and position. Pull the same from Google Analytics 4 if you track conversions per page. Keep the export at page level.
- Compute the decay signal. For each page, compare current-period organic clicks to the prior 90 days. A drop of 20% or more, or a position loss of 5 spots, flags the page for review. Score pages with steeper decay higher on factor 1.
- Map striking distance. Filter for pages sitting in positions 5 to 20 with meaningful impressions. These are the highest-ROI refresh targets because small effort moves them to page 1. Score them higher on factor 2.
- Tag conversion value. Apply a simple 1-to-3 conversion tier based on the query type: bottom-of-funnel and commercial queries score 3, mid-funnel 2, top-of-funnel 1. Do not overthink attribution; a manual tier beats a broken enterprise model. Kapost weights first and last touches at 30% each if you want a more precise route.
- Score, weight, sort, act. Score each page 1 to 5 on all five factors, apply the RPS formula, sort descending, and work the list. Batch the 4.0+ pages first, then the 3.0 to 3.9 pages, and route the rest through the content SEO audit checklist for the page-level fixes.
The whole run takes about three hours for 200 posts. Re-run it quarterly. Airops found that quarterly refreshes outperform annual updates by 42%, and the model tells you which pages to touch each cycle.
How to score beyond the next 90 days: content frequency and AI freshness
The refresh decision is not only what to update, it is how often. Refresh frequency should follow content type, and published research gives you concrete baselines. Siege Media analyzed 17,805 keywords and 17,749 SERPs in an update study and found refresh cycles vary sharply by format. “Best [software]” listicles turned over roughly every 143 days, general “best” lists about every 400 days, how-to guides near 750 days, stats pages around 1,019 days, and calculators about 1,420 days, because their answer stability differs.
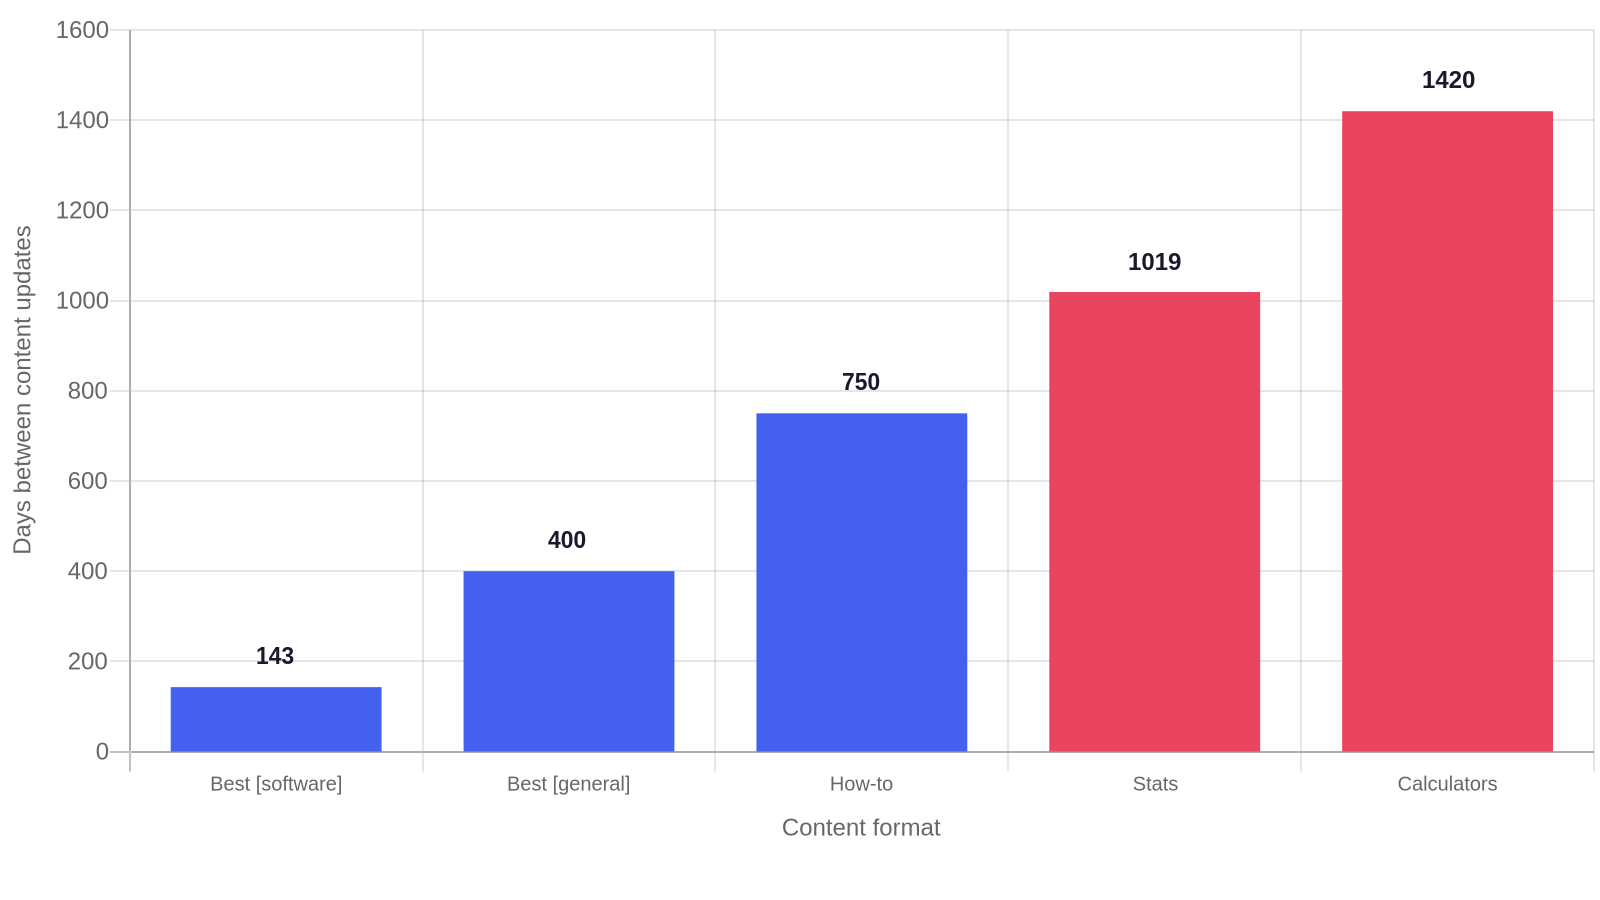
You can build refresh frequency into the scoring model as a decay-floor check. If a page has not been touched within its type’s typical window, add a freshness-points boost to factor 4 even when traffic is flat. This catches what Airops found for AI search: average publication age for AI-cited pages was 1,064 days versus 1,432 days for organic results, a 25.7% recency premium in the citation pool.
Mid-market attribution without an enterprise stack
B2B teams often skip conversion-scoring because “we cannot attribute revenue to blog posts.” You do not need Marketing Cloud to do this. Kapost’s published model weights the first and last touchpoints at 30% each and splits middle touches, and seoClarity uses a four-touch allocation of 0.30 for first and last with 0.20 for the middle. You can approximate both with a simple four-column mapping in a spreadsheet: first touch, last touch, assist 1, assist 2. Assign an MQL value per deal (for example, $50 per MQL from your cost-per-acquisition data) and multiply each page’s touch share by that value.
For lean teams, a manual three-tier tag is enough: commercial and bottom-of-funnel queries get a 3, mid-funnel get a 2, top-of-funnel get a 1. Digital Applied’s prioritization model, which scores pages like 4.06, 3.56, 2.11, and 0.94 in its worked examples, treats conversion weight as an input, not an output of an enterprise platform. You are not building a model to win an attribution war. You are building one to keep the pricing page ahead of the pillow listicle in the refresh queue.
What the refresh case studies actually show
The evidence that fed these weights comes from real B2B programs, not theory. Lightspeed lifted organic visits to refreshed posts by 37%. Quattr’s tech-brand case improved clicks, impressions, and keywords by 37%, 52%, and 65%, and its CloudEagle case lifted clicks 113% and AI citations 3x. Kiteworks saw a 79% lift in answer-engine citations. Buffer stewarded 2,000+ articles through an LLM-assisted refresh pipeline while running at 4x pace, and MarketMuse’s optimization work measurably improved 45 of 50 striking-distance pages. These aren’t single outliers; they are the shapes of a working refresh program, which is exactly what a scoring model feeds.
The gaps most scoring guides miss (and how to fix them)
Three manual problems keep published scoring models from working in practice: arbitrary weights, subjective qualitative scores, and no AI-citation tracking. Fixing all three is what separates a model that gets used from one that gets abandoned.
How to derive weights instead of guessing
Most guides tell you to pick weights by judgment. You can do better with a quick regression on your own data. Take your last refresh batch, record the change in organic clicks after 90 days, and correlate it against the five factors measured before the refresh. The factors that correlate strongest with lift get the higher weights. With even 20 refreshed posts you get a defensible weighting that beats a guess. If you lack the data, start with the research-backed baseline above and adjust after your first two quarterly runs.
How to normalize subjective scores
Qualitative factors like scannability or effort drift between evaluators. Progress’s approach is the fix: build a “sheet before the sheet” that maps each qualitative criterion to a concrete 1-to-5 anchor before anyone scores. For example, scannability 1 means a wall of text with no headings, 5 means clear headings every 250 words with bold key lines and a table. When every scorer uses the same anchors, scores stay comparable. Test it by having two people score the same 10 posts independently and checking for agreement before you scale.
How to track AI citations in the model
AI search behaves differently from Google. Airops reports cited URLs are on average 25.7% fresher, and unrefreshed content over a year old is twice as likely to lose citation eligibility. Track which of your pages are cited by ChatGPT, Perplexity, and Gemini each month, and feed that into factor 4. Pages cited today but published more than 12 months ago are at high risk and deserve an early refresh, because 50% of cited URLs change monthly and only 30% of brand mentions persist month over month.
What most teams get wrong
Most teams treat refresh as a content calendar task instead of a scoring problem, so they update posts chronologically or when someone remembers. That wastes effort on pages that do not matter and ignores the pages that would move revenue.
The second common error is grading content in isolation. A beautiful page that ranks at 60 and converts nothing will score well on Mailchimp-style criteria, yet it is a worse refresh target than an ugly page at position 7 losing traffic. Refresh is an opportunity decision, not a quality judgment.
The third error is ignoring intent drift. Google changes SERP layouts, adds AI Overviews, and reinterprets queries. A page can lose traffic while its content stays perfectly written, because the query it targets changed meaning. Score intent drift explicitly, or your model will keep “fixing” pages that were never broken.
What to do next
Export your Search Console data today and score your top 50 pages by impressions using the RPS formula. Build the scoring sheet with the five factors and the research-backed weights, then run your first quarterly batch. Start with the 4.0+ pages and one light update, and measure the organic clicks 60 days later. That first loop teaches you more than another year of reading about scoring models. If you need the companion processes, our B2B content audit workflow covers the full inventory pass, and the content refresh checklist gives you the exact update steps once a page is scored.
Frequently asked questions
What is a content scoring model in SEO?
A content scoring model in SEO is a weighted system that rates every page across factors such as decay, ranking position, conversion value, and effort, then sorts the list so you prioritize refreshes and updates by expected return. It turns a subjective backlog into a ranked queue.
What factors should a content scoring model include for B2B?
For B2B, include decay velocity, striking-distance position, conversion value, AI citation risk, and effort. Weight decay and position highest, tie conversion value and AI risk second, and keep effort as a tiebreaker so you capture quick wins.
How often should I re-score my blog content?
Re-score quarterly. Airops found quarterly refreshes outperform annual updates by 42%, and decay compounds at about 1.21% per week. A quarterly cadence catches pages before they fall out of striking distance.
Should I refresh or delete a decaying page?
Refresh pages with real impressions, a position between 5 and 20, and conversion value. Prune pages with no impressions, no conversions, and no citations, then redirect them to the closest relevant page to preserve link equity. QuickBooks reversed a 50% traffic drop by deleting half of its thin content.
Does refreshing old content help AI search visibility?
Yes. AI search favors fresher content: cited URLs are about 25.7% fresher than traditional results, and pages over a year old are twice as likely to lose citations. Updating stats, structure, and internal links keeps your pages in the citation pool.
What is the difference between a content score and a refresh priority score?
A content score grades how good a page is today. A refresh priority score grades how much a page will improve if you update it, by combining decay, position, conversion value, and effort. You need the second one to decide where to spend your update budget.
