

Which B2B Content Marketing KPIs Actually Predict Pipeline in 2026?
Most B2B content teams track the wrong numbers. They report pageviews, bounce rate, and lead counts, then wonder why leadership keeps cutting the content budget. The average B2B buyer now consumes about 13 pieces of content before buying, and modern deals involve a buying committee of 6 to 10 people. When you measure content by traffic instead of by pipeline influence, you optimize for the wrong thing entirely.
This guide gives you a complete B2B content marketing KPI framework built around one idea: metrics should be ranked by how close they sit to revenue. It includes the 5-tier revenue proximity hierarchy, real 2026 benchmarks for every key metric, a decision matrix that replaces six vanity metrics with pipeline-predictive ones, and a step-by-step workflow to build your own KPI dashboard.
Here is the short answer up front. Leadership-ready B2B content teams track pipeline-influenced revenue (20 to 35% of pipeline), content-attributed ARR (8 to 15% of closed deals), buying group engagement (3+ roles per account in 90 days), AI Overview citation rate, and content decay rate. They stop reporting aggregate pageviews, bounce rate, and raw subscriber counts. Teams that report pipeline contribution as their primary KPI outperform traffic-focused teams by about 2.7x on year-two program growth.
Why Traditional B2B Content Dashboards Fail to Predict Pipeline
Traditional dashboards fail because they measure activity instead of outcome. A dashboard built on pageviews, unique visitors, and time on page tells you how much content you produced and how many people glanced at it. It tells you nothing about whether that content moved a qualified account closer to a purchase. That gap is expensive.
A 2025 Digital Marketing Institute guide to content marketing metrics noted that 56% of content marketers call attributing ROI to content efforts their top challenge, and another 56% struggle to track customer journeys. The explanation is simple. Most teams never built the measurement system for those two jobs in the first place.
The deeper problem is that a B2B purchase is an account-level event, not a single-person event. Six to ten stakeholders weigh in on a typical deal. Each one consumes content at a different stage. A linear, single-buyer dashboard cannot represent that. The metrics that predict revenue in this environment are account-level and role-based, not page-level and session-based.
The fix is the Revenue Proximity Hierarchy, a way to organize every content metric by how far it sits from cash. It gives the CFO the revenue numbers, the CMO the pipeline numbers, and the content lead the behavior and discovery numbers, while keeping everyone looking at the same dashboard and the same definition of winning.
The 5-Tier Revenue Proximity Hierarchy: Aligning CFO Outcomes with Creative Activity
The Revenue Proximity Hierarchy sorts content metrics into five tiers from closest to farthest from cash. Each tier maps to a specific audience inside your company, because a metric that means nothing to a writer can be the deciding number for a CFO. The hierarchy is the framework this guide is built on.
Why this hierarchy matters so much in 2026 is that it changes who reviews which number. The CFO sees Tier 1 revenue metrics and stops asking why pageviews are flat. The content lead sees Tier 3 behavior and knows exactly which assets to refresh. The SEO strategist owns Tier 4 discovery and is measured on whether the brand shows up in AI answers, not just in blue links. Every tier feeds the one above it, so a writer who improves Tier 5 cadence is visibly contributing to the Tier 1 number the whole company cares about.
Tier 1: Board-Defensible Revenue KPIs and the Labor Denominator Problem
Tier 1 is where content proves financial value, or fails to. The three revenue KPIs that matter are pipeline-influenced revenue, content-attributed ARR, and cost per content-sourced opportunity. Getting these right changes the budget conversation completely, because they speak the language finance uses.
Pipeline-influenced revenue. This is the total ARR from active opportunities where at least one content piece appears in the touch sequence before the opportunity was created. For a mature program, a healthy target is 20 to 35% of total pipeline. If your content is not touching a meaningful share of pipeline, you have a distribution or a quality problem, not a volume problem.
Content-attributed ARR. This is stricter. It counts only closed-won ARR deals where content earned the attribution through a first-touch or W-shaped model. The realistic target is 8 to 15% of closed ARR. Note that this is lower than pipeline-influenced revenue, because many content-touched deals close on the strength of later sales-touch work. That is normal and expected.
Cost per content-sourced opportunity. Your total content spend plus your team and labor cost, divided by the opportunities where content was the first touch. The target range is $800 to $2,500 depending on your average contract value. Below $800 with a high ACV, you are underinvesting. Above $2,500 with a low ACV, your content engine is too expensive to scale.
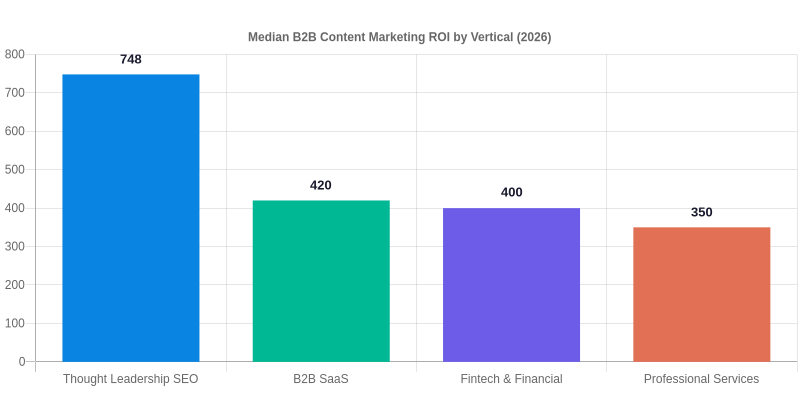
Here is the part most guides skip. The denominator in your content ROI calculation is almost certainly wrong, because it leaves out labor. Gartner’s 2025 CMO Spend Survey found that internal labor accounts for roughly 22% of total marketing budgets at companies above $1B in revenue, and agencies add another 21%. Together that is 43% of total marketing spend. If you calculate ROI on freelance invoices and software only, a 700% number is an illusion that collapses the moment finance asks what your team actually costs.
The defensible move is fully loaded costing. Include internal writing and editing labor, SME interview hours, project management, software allocation, and distribution spend in the denominator. A truly loaded cost base changes what a “good” number looks like. The columnfive research on content marketing ROI flagged that ROI below 200% signals an underperforming program, while returns above 500% are real but rare and often trace to a shaved denominator. A conservative 200% on an honest cost base survives a CFO review far better than a bold 700% on a fake one.
The three Tier 1 revenue KPIs and their 2026 targets at a glance:
Content-attributed ARR: 8 to 15% of closed ARR
Cost per content-sourced opportunity: $800 to $2,500
Tier 2: Opportunity-Predictive Pipeline Metrics and Buying Group Engagement
Tier 2 is where you prove content creates opportunities, and the single most predictive metric here is not the lead count. It is the buying group engagement score, because a B2B sale is won by a group, not a lead.
Buying group engagement score counts the number of unique roles from the same target account that engage with your content over a rolling 90-day window. A finance director, a technical architect, and an operations lead viewing your content counts as three distinct roles from one account. This is the account-level cousin of an MQL, and it predicts revenue far better.
The benchmark data is stark. Pipeline showing active engagement from three or more unique roles from the same account converts to closed-won at roughly three times the rate of pipeline showing single-role engagement. That is the difference between guessing who is serious and knowing.
Sales content usage rate is the second Tier 2 KPI. It measures the percentage of active sales reps that use your content in deal sequences or conversations each month. The target is 60 to 80% usage. This metric is a bridge. When sales actually uses the content you make, the content team stops being a cost center and becomes a sales multiplier.
Sales enablement data makes the payoff concrete. Reps who use customer story videos in late-stage deals see about 27% shorter deal cycles, and teams with a unified content enablement platform are about 42% more likely to improve win rates. If your sales team ignores your library, no dashboard metric will save you. Go fix the content sales is not using.
Tier 3: Reconciling Content Behavior with the Dark Social Attribution Gap
Tier 3 tracks what buyers actually do with your content, and it confronts an uncomfortable truth: most software attribution is blind to where B2B revenue really starts. If you trust it blindly, you will defund the channels that actually work.
Refine Labs ran a revealing comparison. In a survey where customers answered the question “How did you hear about us?” during a demo request, 97% of closed revenue traced to dark social channels: 44% social media, 30% podcasts, 13% communities, and 10% word of mouth. At the same time, digital attribution software credited dark social at near zero and instead assigned 82% of revenue to search and direct. The two systems told opposite stories.
The practical response is hybrid attribution. Run your multi-touch software model, but add an open-text field to your demo request and form flow that asks how the prospect heard about you, and reconcile the two regularly. It is a small change that prevents you from gutting a podcast or community program that software simply cannot see.
On the content side, the behavior KPIs to watch are ICP-fit engaged sessions and return visitor rate. Return visitor rate of 30% or more signals you are building a repeat audience, and engaged time of two-plus minutes on long-form content signals real reading, not a bounce. Bounce rate is a poor standalone signal, because answer-engine content that fully answers a query on the page can show a high bounce even when it did its job.
Tier 4: Zero-Click SEO and Tracking AI Overview Citation Rates
Tier 4 is discovery in a market that has changed. Organic traffic is no longer a stable KPI, because AI Overviews now intercept a huge share of queries before any click happens. Any 2026 B2B content dashboard that only counts organic clicks is missing the fastest-growing source of brand presence.
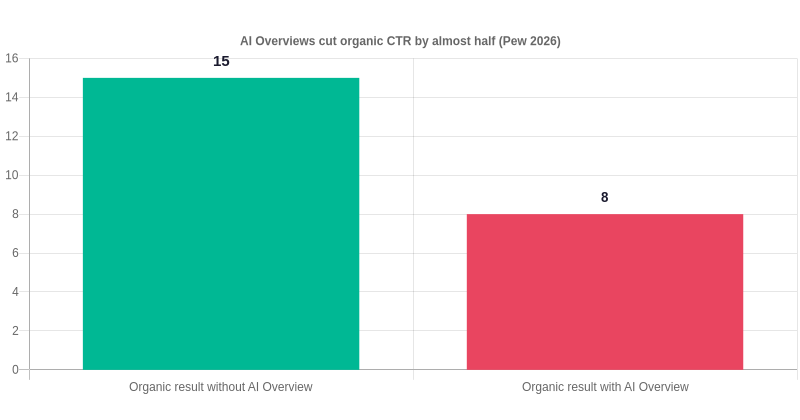
The numbers are decisive. Google’s AI Overviews now appear above organic results for about 82% of B2B technology queries. When an AI Overview is present, the click-through rate on organic results drops by about 46.7%, from a 15% baseline to 8%. Only about 1% of users click the citation links inside an overview. Yet the same research shows enterprise buyers moving to AI tools as a primary discovery channel jumped from 24% to 84% in a single 12-month period.
That collapse of clicks does not mean search stopped mattering for B2B. It means the winning metric shifted from being clicked to being cited. The KPI that captures this is the AI Overview citation rate: the percentage of your priority, high-intent queries where your domain or content is cited in an AI answer. For an established topical authority, a target of 15 to 40% citation rate is realistic. Only about 12% of surveyed B2B content teams track this metric today, which is exactly why it is an opening.
Why this belongs in a KPI framework and not an SEO report is that citation wins translate into pipeline. A buyer who uses ChatGPT or Perplexity to shortlist vendors will never click a blue link, but the vendor named in the answer is now in the consideration set. Measuring citation rate lets you see that influence arrive before the sales conversation does.
Portfolio Maintenance: Content Decay Rate and Refresh Performance Lift
Tier 3 includes two portfolio-health KPIs that most teams never track, and they are among the most valuable numbers in this whole framework. They measure the health of what you have already published, not what you produce next.
Here is the asymmetry that makes these metrics so valuable. HubSpot research across 20,000 posts and 15,000 companies found that only about 10% of blog posts are compounding assets whose traffic grows over time, but that 10% generates about 38% of total blog traffic. A compounding post averages 2.5 times its launch-month traffic by month six and three times by month twenty-four. The other 90% of your library is either flat or slowly decaying.
Content decay rate measures the percentage of your top-100 traffic-generating pieces that lose 20% or more of their organic traffic quarter over quarter. A healthy number is under 15%. Above 25%, you have a refresh backlog that is destroying value daily. If this number is climbing, start with our content decay report template, which shows how to spot the offenders fast.
Refresh performance lift measures the average traffic increase you get from refreshing an evergreen asset, evaluated ninety days after the update. A solid strategic refresh typically returns a 50 to 150% traffic lift within that window. This turns maintenance from a chore into a predictable growth engine, and it is exactly where our B2B content operating system playbook starts.
The 6 Vanity Metrics to Retire (and What to Track Instead)
This decision matrix is the single most useful table in the guide. It pairs six classic B2B content marketing metrics that make your dashboard look busy with the pipeline-predictive replacements that actually drive decisions. Swap them out one at a time, not all at once, and watch what happens to the quality of the conversation with leadership.
Two of these swaps deserve a closer read. Retiring total pageviews in favor of ICP-fit traffic reframes every report around your best-fit accounts, which is the whole point of B2B. And retiring total pieces published changes behavior most of all, because it stops rewarding volume for its own sake and starts rewarding content that actually contributes to pipeline. That single swap killed the worst incentive in B2B content marketing.
Worked Example: Building a 2026 B2B Content KPI Dashboard in 6 Steps
This is the step-by-step workflow. It shows how to turn the framework and benchmarks above into a working dashboard, using one realistic scenario from first principles.
Scenario. Meet Priya, the content marketing lead at a fictional B2B analytics company called MeridianInsight, a $40M ARR SaaS business with a six-person content team and a 4:1 target CLTV:CAC. Her dashboard today reports pageviews, bounce rate, MQLs, and total subscribers, and her CEO just asked what content actually contributes to pipeline. Priya needs to rebuild the dashboard in six steps.
Step 1: Map your territory into the five tiers. Priya writes down every number she currently reports and places it on the hierarchy. Pageviews and subscribers are Tier 5 activity. MQLs are a weak Tier 2. She finds she has no Tier 1 revenue metrics at all, which is exactly why the CEO question stung. She also identifies her top 100 organic pieces by traffic for later tracking.
Step 2: Fix the ROI denominator first. Before modeling revenue, Priya loads her true cost base. Her team of six at a blended $120k loaded annual cost plus $40k in tools, freelance, and distribution gives a total content investment of roughly $760k for the year. That fully loaded number becomes the denominator for every ROI and cost-per-opportunity calculation.
Step 3: Set up account-level engagement tracking. Priya works with RevOps to enable a reverse-IP firmographic match in her analytics and her CRM. Now she can see sessions coming from matched target accounts and count the number of unique roles from each account engaging over 90 days. The 3-plus-roles rule becomes her leading pipeline signal.
Step 4: Add the attribution bridge. Beyond her multi-touch software model, Priya adds an open-text “How did you hear about us?” field to the demo request form. She reconciles it against the software model quarterly, so dark social contributions do not get silently defunded. She also asks sales to track content usage in deals so she can report the sales usage rate.
Step 5: Build the two portfolio-health metrics. Priya sets a scheduled query that flags her top 100 pieces losing 20% or more of quarterly traffic. That is her decay rate. Every quarter she refreshes two or three of the worst offenders and measures the ninety-day lift. She also plots AI Overview citation rate for her 50 priority keywords using a manual plus tool-based spot check, because no team at her size has it automated.
Step 6: Report top-down, forecast bottom-up. Priya’s monthly report to the CEO leads with Tier 1 pipeline-influenced revenue (her goal is 25% of pipeline), content-attributed ARR (goal 12%), and cost per content-sourced opportunity. RevOps owns Tier 2. She owns Tier 3. SEO owns Tier 4. Everyone sees the same single page, and for the first time the writer who improved cadence can point at the Tier 1 number it feeds.
The dashboard now answers the CEO’s question, and so should yours. If pipeline-influenced revenue is under 20% of total pipeline after you apply these six steps, you have found a real gap to work on, not a mystery to hand-wave.
What Most Teams Get Wrong About B2B Content Marketing KPIs
Across the teams we analyzed, five recurring mistakes keep the metric system from predicting pipeline. Each one is subtle and each one silently caps performance.
1. They measure the lead, not the buying group. Almost every B2B dashboard still centers the individual MQL. But a deal is won by a committee of 6 to 10 stakeholders. The metric that matters is how many distinct roles from a single account engage, and the 3-plus-roles conversion premium is the proof. Stop rewarding single-lead volume and start rewarding account depth.
2. They treat organic traffic as a stable KPI. With AI Overviews on 82% of B2B tech queries and click-through rates down by nearly half when they appear, raw organic clicks understate your real discoverability. Teams that ignore AI citation rate are flying blind into the largest shift in search since SEO began.
3. They calculate ROI on a fake denominator. Ignoring internal labor and agency cost, which together can reach 43% of total marketing spend, produces a beautiful number that fails finance review. Fully load the denominator and defend a lower, honest number.
4. They trust attribution software on its own. Software is blind to dark social, and the Refine Labs data shows it can misattribute 82% of revenue to search and direct when the real source is a podcast or a community. Reconcile software attribution with self-reported survey data.
5. They measure production, not decay. Reporting total pieces published rewards volume while 90% of the library decays quietly. The compounding 10% generates the majority of traffic. Track decay rate and refresh lift instead of feeding the content graveyard.
6. They report a flat list instead of a hierarchy. Dumping twenty metrics on one dashboard means the CFO ignores all of it. The Revenue Proximity Hierarchy gives each stakeholder the tier they own, which is how a metric system survives contact with the executive team.
Fix these six and your measurement system stops being a reporting chore and starts being the tool that wins the next budget.
Frequently Asked Questions
What is a good B2B content marketing conversion rate?
A benchmark of 2 to 5% conversion rate is considered good for lead generation content, according to the WordPress VIP analysis of content marketing KPIs. Long-form video such as 30 to 60 minute webinars converts far higher, around 17%, while short-form clips convert at an average of about 2%. Use format-specific benchmarks rather than one blanket number, and compare like for like.
How do I measure B2B content marketing ROI?
Content marketing ROI is (content revenue minus content investment) divided by content investment, times 100. The critical detail is the denominator. Load it with freelance, software, project management, internal writing and editing labor, SME interview hours, and distribution spend. On a fully loaded cost base, an ROI below 200% signals an underperforming program and returns above 500% are rare. For the full technique, see this B2B marketing ROI framework from HockeyStack.
What is the difference between a KPI and a metric in content marketing?
A KPI is a high-level metric tied directly to a strategic goal, tracked to make a decision. A metric is any measured value, many of which are tactical and daily. The 5-tier hierarchy sorts which metrics earn KPI status by their proximity to revenue, so pageviews stay a metric and pipeline-influenced revenue becomes a KPI.
What are the most important B2B content marketing KPIs for 2026?
The highest-impact KPIs for 2026 are pipeline-influenced revenue (target 20 to 35% of pipeline), content-attributed ARR (8 to 15% of closed ARR), buying group engagement (3+ roles in 90 days), AI Overview citation rate (15 to 40%), and content decay rate (under 15%). Together they span revenue, pipeline, behavior, and discovery.
Why do AI Overviews matter for content KPIs?
Because AI Overviews appear on about 82% of B2B tech queries and cut organic click-through by nearly half, counting clicks alone now understates your real discoverability. The AI Overview citation rate captures brand presence in the answers buyers consult before they ever visit your site, so it is a leading indicator of pipeline.
Should I track bounce rate for B2B content?
Not as a headline KPI. Aggregate bounce rate misreads answer-engine content that fully answers a query on the page, which can show a high bounce even when it did its job. Track return visitor rate (30%+ is strong) and task completion instead, and reserve bounce rate for diagnosing specific page issues.
What To Do Next
Start with one inbox, not five. Pick the single metric from this framework that would most change a conversation you are about to have, and build it this week. For most teams, that is the AI Overview citation rate or buying group engagement, because both are new enough that very few competitors report them well.
Then work through the six-step dashboard build above. Fix your ROI denominator, enable account-level engagement tracking, add the dark social survey question, and stand up the decay and refresh metrics. Pair this measurement work with our guide to measuring blog ROI with GA4 and CRM only if you need the technical setup, and keep it aligned with your overall content marketing strategy.
Finally, book a review of your dashboard against this guide once a quarter. The marketplace shifts fast, and the metric that predicted pipeline in 2025 will not be the one that predicts it in 2026. Your measurement system should evolve as deliberately as your content does.
