
A content decay report tracks which pages on your site are losing clicks, impressions, or rankings over time, so you catch the drop before it turns into a permanent loss. You build one by pulling monthly Google Search Console data for every URL, comparing each page against its own peak month, and flagging anything that has lost a meaningful share of its traffic for more than two months running.
Most teams find out a page is decaying only after someone notices the whole blog’s traffic is down. By then you’ve usually lost three or four months of compounding decline you could have caught early. A decay report fixes that by giving you a running, page-level view instead of a site-wide number that hides which specific posts are the problem.

What a Content Decay Report Actually Tracks
A decay report is not the same as a traffic dashboard. A dashboard shows you where you are. A decay report shows you the direction and speed of the drop, page by page, so you can act while the loss is still small.
At minimum, the report needs three data points per URL: current month clicks, peak month clicks in the trailing 12 months, and the percentage difference between the two. Most teams add impressions and average position as a second layer, since a page can lose clicks while impressions hold steady, which usually points to a ranking drop rather than falling demand for the topic.
The free templates you’ll find from tools like Coefficient or Clearscope’s built-in report are good for the raw numbers. What they don’t give you is a way to decide which decaying pages to fix first when you’re a two-person content team and can’t touch all of them this month. That’s the part worth building yourself.
The Decay Signal Score: A Framework for Prioritizing What to Fix
Call it the Decay Signal Score, or DSS. It’s a single number per URL that combines how much traffic a page has lost with how much that page is actually worth to your business, so you’re not chasing every dip with equal urgency.
The score has three inputs, each scored 1 to 5:
Click Loss Severity. Compare current-month clicks to the page’s peak month in the trailing 12 months. A drop under 15% scores a 1. A drop of 50% or more scores a 5.
Duration. How many consecutive months has the decline held? A single bad month scores a 1, since it’s often noise or seasonality. Three or more consecutive declining months scores a 5, since that’s a trend, not a blip.
Business Relevance. Does this page target a keyword tied to revenue, like a comparison or template page bottom-of-funnel readers search for, or is it a top-of-funnel piece with no direct commercial intent? Score 1 for low-relevance informational content and 5 for anything that sits close to a conversion.
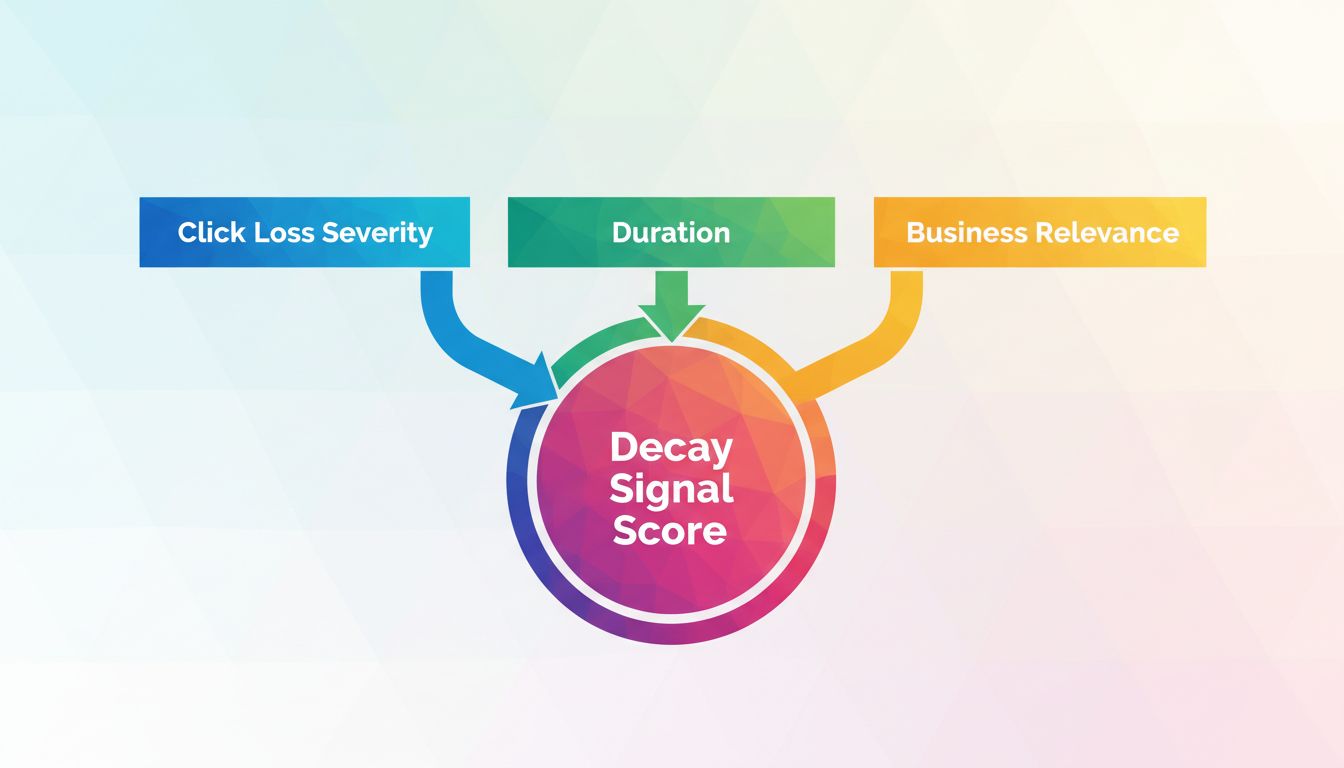
Multiply the three scores together. A page with severity 5, duration 5, and relevance 5 gets a DSS of 125, the highest-priority fix on your list. A page with severity 5 but relevance 1 gets a DSS of 25, which tells you the traffic loss is real but the business impact is small enough to queue behind higher-relevance pages.
This matters because click-loss percentage alone is a bad prioritization tool. A page that dropped from 40 clicks to 15 clicks looks worse in raw percentage terms than a bottom-of-funnel comparison page that dropped from 400 to 300, but the second page is losing five times the volume and probably ten times the pipeline value.
Manual Export vs. Spreadsheet Template vs. Paid Tool
| Method | Setup Time | Ongoing Effort | Cost | Best For |
|---|---|---|---|---|
| Manual GSC export each month | 20-30 min/month | High, fully manual | Free | Teams checking fewer than 50 URLs |
| Google Sheets template with DSS scoring | 45-60 min once | Low, mostly copy-paste | Free | Small B2B teams wanting repeatable prioritization |
| Paid decay tool (Clearscope, ContentKing, etc.) | Under 10 min | Very low, automated | $100-$300+/month | Teams tracking 500+ URLs or wanting alerts |
For a one- or two-person content team, the spreadsheet template is almost always the right call. A paid tool earns its cost once you’re managing a content library large enough that manual review genuinely doesn’t scale, usually somewhere past a few hundred published pages.
Step-by-Step: Building the Report
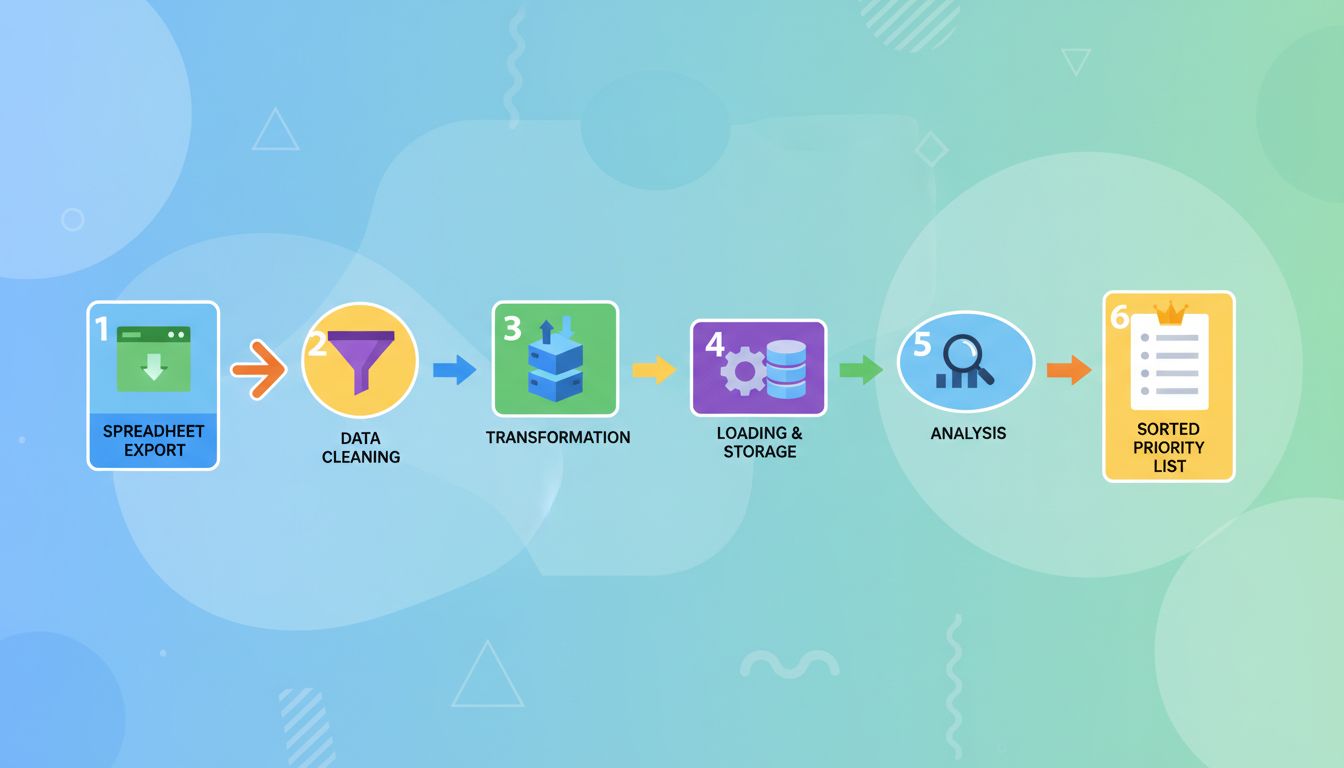
1. Export 12 months of page-level data from Search Console. Go to Performance, filter by Page, set the date range to the last 12 months, and export to Google Sheets. You want clicks, impressions, and average position per URL, per month.
2. Build a monthly tab structure. Create one tab per month with the same columns, or use a pivot table if your export supports it. The goal is a clean row per URL per month so you can reference peak values later.
3. Calculate peak month and current month per URL. In your main tracking tab, use a MAXIFS formula to pull each page’s highest click month from the trailing 12, then reference the current month’s value next to it.
4. Calculate percentage change and consecutive decline months. Percentage change is straightforward subtraction and division. Consecutive decline months takes a bit more formula work, comparing each month to the one before it and counting a running streak.
5. Score each URL on the three DSS inputs. This is the one manual step. Severity and duration can be semi-automated with formulas based on thresholds you set. Business relevance needs a human judgment call, since it depends on what you know about the keyword’s funnel stage and conversion value that Search Console data alone won’t tell you.
6. Sort by DSS descending and set a review cadence. Anything scoring above roughly 60 goes into this month’s refresh queue. Review the full report monthly, not quarterly. Decay compounds, and a page caught at month two is a much smaller fix than the same page caught at month six.
Use the B2B Content Decay Report Template to skip building the formulas from scratch.
What Most Teams Get Wrong
The biggest mistake is treating every decaying page the same. Teams build a decay report, see forty pages with declining clicks, and either freeze because the list feels overwhelming or start at the top alphabetically instead of by actual business impact. The DSS framework above exists specifically to stop that.
The second mistake is confusing seasonal dips with real decay. A page about year-end budget planning will naturally drop in April. If you’re not checking year-over-year rather than just month-over-month, you’ll flag seasonal content as broken and waste a refresh cycle on a page that was never actually declining.
The third mistake is only tracking clicks. A page can hold steady on clicks while its average position slides from 4 to 9, which means it’s about to fall off a cliff next month. Impressions and position are leading indicators. Clicks are a lagging one. If you only watch the lagging indicator, you’ll always be a month behind the actual problem.
The fourth mistake is building the report once and never touching it again. A decay report is only useful as a recurring habit. Set a recurring calendar block, even fifteen minutes, to update the tracking tab and rescore anything new. A one-time audit tells you what happened. A recurring report tells you what’s happening.
FAQs
How is a content decay report different from a content audit?
A content audit is a broader, usually quarterly review of your entire content library covering quality, accuracy, and relevance. A decay report is narrower and more frequent, focused specifically on traffic trend data to catch declining pages before the next full audit cycle.
How often should I update a content decay report?
Monthly, at minimum. Search Console data updates daily, but pulling a fresh export monthly is frequent enough to catch trends early without turning report maintenance into a full-time task for a small team.
What counts as a meaningful decline versus normal fluctuation?
A single month dropping 10-15% is usually noise. Three or more consecutive months of decline, or any single month dropping more than 30%, is worth investigating. Always compare against the same month last year before concluding it’s real decay rather than seasonality.
Do I need Google Analytics data too, or is Search Console enough?
Search Console alone is enough to build a functional decay report, since clicks, impressions, and position are the core signals. Analytics data on bounce rate and time on page adds useful context once you’re deciding how to fix a flagged page, but it’s not required to identify that a page is decaying in the first place.
Can I automate the Decay Signal Score instead of scoring business relevance manually?
Severity and duration can be fully automated with spreadsheet formulas. Business relevance genuinely needs a human decision, since it depends on funnel stage and revenue proximity that raw traffic data doesn’t capture. Most teams keep a simple reference tab mapping each URL to a 1-5 relevance score set once and updated only when priorities shift.
What should I do with a page that scores high on decay but low on business relevance?
Queue it behind higher-relevance fixes rather than ignoring it. If a low-relevance page keeps declining for six-plus months with no action, it becomes a pruning or merge candidate rather than a refresh candidate. Use the report’s duration column to make that call.
What To Do Next
Pull your last 12 months of Search Console page data this week and build the tracking tab described above, even a simplified version with just peak-vs-current clicks. Score your top 20 highest-traffic pages on the Decay Signal Score before touching anything else. Fix the pages scoring above 60 first, since those are the ones actually costing you pipeline. Set a recurring 15-minute monthly block to update the report, and cross-reference anything flagged against your content refresh checklist before you start editing. Avoid the trap of building this once and letting it go stale. It only earns its keep as a habit.
Related reading: How to Find Outdated Blog Posts Using Google Search Console, How to Prioritize Blog Posts for Content Refresh, and the Content Marketing ROI Predictor to weigh refresh effort against pipeline impact.
Download the B2B Content Decay Report Template to start scoring your own pages with the Decay Signal Score.
